Visualizing Historical Space

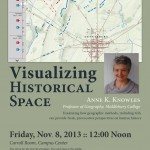
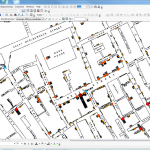
Great opportunity to learn about Historical GIS (HGIS) from one of the leading thinkers in the field.  Anne Knowles from Middlebury College will be on campus this Friday, November 8th to discuss her work on visualizing  the Battle of Gettysburg.  Explore the online map for a little preview: A Cutting Edge Second Look at the Battle […]

ENV 201/202, Fall 2013

Food Desert Interactive Maps: USDA Food Environment Atlas: http://www.ers.usda.gov/data-products/food-environment-atlas/go-to-the-atlas.aspx#.UmrR3fmKLAk USDA Food Access Research AtlasL http://www.ers.usda.gov/data-products/food-access-research-atlas/go-to-the-atlas.aspx#.UmrAWfmKLAl ESRI Food Desert Finder: http://megacity.esri.com/fooddeserts/#-10570450.2925;4722931.8985;10 Another version of the same map: http://www.arcgis.com/explorer/?open=153c17de00914039bb28f6f6efe6d322 Social Explorer: http://www.socialexplorer.com/89AACD3A4F1E4E1/explore Things to think about while exploring the maps: How are the creators of this map defining a “food desert”? What spatial data are they including in their criteria? Is the […]

News Update 10/17: Fall Semester So Far

Well, looks like it’s time for another news update! My excellent intentions to write a short blog-style post about Spatial Analysis Lab activities are always undermined by my less-than-excellent ability to keep track of the weeks as they fly by at a breakneck pace. Fall Break just ended and as we prepare to support some […]

Fall 2013 Spatial Analysis Lab Workshop Series

This fall, the Smith Spatial Analysis Lab will be offering a series of GIS and GPS workshops to Smith and Five College students, faculty, and staff. Whether you are taking or teaching a class that involves spatial data, interested in using geospatial technologies in research, or just want to know what all the fuss is […]

Summer Science: Useful Links

Comparing aerial photos: Google Imagery Bing Imagery If it doesn’t automatically load the Sattelite/Aerial imagery, find the option in the menu bar to switch to this view. Questions to talk about with your partner: What happens as you zoom in and out? Do the Bing and Google imagery adjust at the same zoom levels? What […]

An Interesting Map For Your Friday Afternoon!

Food for thought over the weekend: a state-by-state map of the highest-paid public employees. (via Deadspin – click map to enlarge)   This map is a great example of why maps are an efficient way to communicate data. Could this data be visualized using a bar graph, or a pie chat? Yes. Absolutely. But putting it […]

News Update: John Snow’s Map and World Populations Class

This semester has flown by– it’s hard to believe that Spring Break has already come and gone. Though much of what we do in the SAL is support classses on an ongoing basis throughout the semester (like ENV 201/202 and ARH 150), it is always fun to have the chance to work with classes for […]

March Mystery Map Solution

How did Caesar get through the Ides of March? How will you? If your answer to that question is “Caffeine Consumption,” then you’re not alone. One source estimates that 80-90% of adults in North America consume caffeine habitually. To draw attention to the prevalence of caffeine use in America, March has been designated as National Caffeine […]

March Mystery Map Released!

New Mystery Map: “The Ides of March” What do the green dots represent on the map? March is upon us, definitively storming in like a lion and hopefully quickly transitioning to lamb-like tendencies. March brings both the good and the bad: snow storms, mid-term exams, Spring Break, and St. Patrick’s Day, to name a few… […]

January Mystery Map Answer Released!

January Mystery Map: “Hear ye, hear ye!” What mystery variable is taking over the Smith College campus? The answer is: The mystery map shows the location of chalkings on the Smith College campus. Additionally, the color of each dot corresponds to the content of the chalking, which we classified into six categories: events on campus, inspirational […]