Although embedded deeply within the Sciences at Smith, the Spatial Analysis Lab routinely crosses boundaries to work in other domains. One recurring theme is mapping justice and the typical focus is environmental justice given our grounding. But more recently our attention is drawn to issues involving social/economic justice and inequality. Much of our work in […]
Tag Archives: Cartography
Collaboration with the Art Museum!
by Karen Yu, Spatial Analysis Lab Assistant Despite its physical appearance, the Spatial Analysis Lab (SAL) is more than just a computer lab in Sabin Reed. Behind the scenes, we’re often busy with new projects, teaching, and always thinking spatially. Recently, the Art Museum reached out to collaborate with the SAL on a new exhibit […]
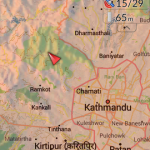
Nepal Earthquake Response Workshop Well Attended in the Week Before Finals
The Humanitarian OpenStreetMap Team has developed a project called MapGive, which allows volunteers to populate maps in parts of the world where mapping resources are limited. The idea originated following the 2010 earthquake in Haiti when mapping the island’s infrastructure through GPS surveying on foot proved too dangerous and not fast enough. As an alternative OpenStreetMap provided a […]
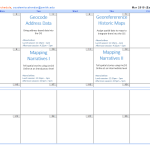
Spring ’15 Workshop Offerings
Workshops offered by the SAL in spring 2015 — together they provide an introduction to mapping and GIS (Geographic Information System), and separately provide skills for particular GIS tools and skills — mapping addresses data, using GPS unit to collect data, etc. Note: most of our workshops can be taken as stand-alone workshops, however the workshops that […]
Smith College Rail System
Geo-artist Elena Terhune ’14 created this awesome map of an imagined Smith College Subway System. Check it out, and read what she has to say about the process of creating it: “Especially in the colder winter weather, we have all idly wished for some way to travel quickly and warmly. Smith’s Spatial Analysis Lab heard you, […]
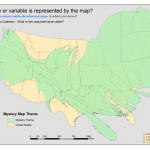
Cartograms
A cartogram is a thematic map in which some variable (e.g. population) is substituted for land area. The alternate variable is conveyed through a distorted geometry of the map. This example displays the state origins of the Smith Class of 2012. December 2008 Mystery Map displaying class of 2012 as a cartogram View as a […]