by Karen Yu, Spatial Analysis Lab Assistant Despite its physical appearance, the Spatial Analysis Lab (SAL) is more than just a computer lab in Sabin Reed. Behind the scenes, we’re often busy with new projects, teaching, and always thinking spatially. Recently, the Art Museum reached out to collaborate with the SAL on a new exhibit […]
Tag Archives: Visualization
Fall 2015 Mystery Map-Data
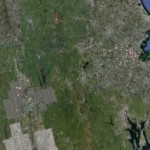
We have cool, shiny new LiDAR data to play with in the Spatial Analysis Lab. These data were captured in December 2013, but we did not receive the final product until earlier this summer. We’ll provide more details about LiDAR, and our plans for processing and analysis after the Mystery Map competition is complete. Until […]
November Mystery Map Revealed — Mystery Migrations
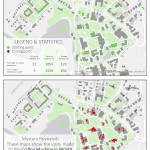
Answer Revealed This mystery map challenged viewers to anticipate movements on campus based on a set of starting points and ending points. What quest is shown on the map?? The journey to the Lewis Global Studies coffee machine! The map was inspired by a mapping survey conducted at this coffee machine in Wright Hall. The survey gathered […]
April 2012 Mystery Map Solved
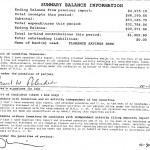
The Answer is The April 2012 Mystery Map reveals monetary contributions to David Narkewicz and Michael Bardsley during the 2011 Northampton Mayoral Campaign. The points are located at the contributor’s address and sized proportionally to indicate the amount of contribution. Each point is color coded by candidate: Narkewicz is light green, Bardsley darker green. And, the winner […]
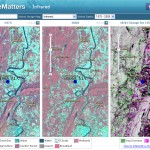
Landsat Imagery Services
These image services enable fast and easy access to 30 years of Landsat imagery as part of ArcGIS Online.
Smith Alumnae
Download the Google Earth file and explore: Spatial Mean (kmz)
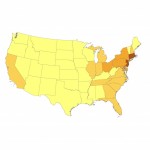
Data Classification
Simple changes in data classification alter the patterns and display of a map. Examples of mapping 1990 US Population Density.
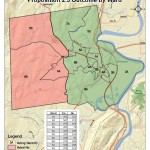
Community Divided?
Mapping the comfortable margin of the Northampton Proposition 2 1/2 override tells a different story…