Cartograms

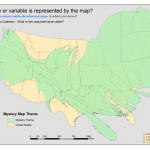
A cartogram is a thematic map in which some variable (e.g. population)  is substituted for land area.  The alternate variable is conveyed through a distorted geometry  of the map.  This example displays the state origins of the Smith Class of 2012. December 2008 Mystery Map displaying class of 2012 as a cartogram View as a […]

2008 Presidential Campaign Contributions

The “background” portion of the map represents total campaign contributions per Massachsuetts town. This type of map is referred to as a Choropleth Map in which areas are shaded based upon a particular theme or value. In this case, our theme is total campaign contributions. By convention it is best to represent a rate or […]

Northridge Earthquake

This example demonstrates display of space and time events.  Data were developed and animated in ESRI’s ArcGIS software and exported to a QuickTime movie format. Northridge Animation (Quicktime Movie showing number of aftershocks by time and location)               Originally developed for a textbook on GIS and Natural Disasters.

The Power of Maps

I’m just starting to track who looks at our webpage and in particular the maps that are posted.  I never dreamed that such fist-o-cuffs would erupt over our animated map showing the history of US settlement.  I (add some of the students who work with me) created this map for a political science instructor.  I […]

Monitoring Field Leader Position

Monitoring Field Leader Position at University of Montana. Position Responsibilities Use GPS to map weed invasion, wilderness character, and recreation impacts Implement protocols to collect weed, recreation and wilderness character data Conduct restoration activities, including weed-pulling and campsite restoration Educate/train volunteers in wilderness issues, monitoring, and restoration Adapt to changing field conditions, e.g. weather, route […]

Geospatial Occupations

US Department of Labor/Employment and Training Administration’s Occupational Information Network (O*NET) now lists five new geospatial occupations: “Geospatial Information Scientists and Technologists”, “Remote Sensing Scientists and Technologists”, “Geographic Information Systems Technicians”,  “Precision Agriculture Technicians”, and “Geodetic Surveyors”. Search for “geospatial” in the  Occupation Quick Search at the O*NET site http://online.onetcenter.org/ Direct link for Geospatial Information […]

What does your policy look like?

Back in February 2007 I asked one of my student assistants to generate a new map for the mystery map series.  At that time I was very interested in visualizing administrative policies manifestation on the landscape.  All too often, policies are created and enacted without any insight as to how they will overlay on the […]

Watering the rain

photo taken June 09 2009 Seeing the sprinklers water the lawn after 0.3″ of rain the other day got me thinking there has to be a better way. I’ll admit that I don’t know how or when the sprinklers are set to water, but this is 2009 and we are Smith College!! Why not have […]

Springtime on Campus

What a great time of year. A time to relax, reflect, and smell the springtime flowers. Oh, and yes, there a plenty of opportunities to take in that pesticide residue smell… 🙁 Note: photos are geotagged. Download this Google Earth file (pesticides2009.kmz) so you can plan ahead, or around, if you like 😉 ——————————————————————————————————–