2.8 Kinetic Theory of Gases
The motions of atoms in gases are well understood based on the kinetic theory of gases (see Libre Text). The velocites and kinetic energies of atoms or molecules in gases are described by the Maxwell-Boltzmann statistical distribution (see Kahn Academy). Although bonding makes the motions/vibrations of atoms in minerals and magmas more complicated than the motions of gas molecules, the statistical distributions of atom motions in minerals, magmas, and gases are likely to respond to temperature in similar ways.
Gas molecules have a wide range of velocities and kinetic energies at any temperature, but the average velocity and average kinetic energy both increase with temperature. The distribution of the velocities of gas molecules as a function of temperature is given by the Maxwell-Boltzmann Distribution Function. A graph showing this function is drawn in Figure 14. Click on the figure above to see a larger, interactive version.
Notice how fast the gas atom are moving (see the x-axis in Figure 14a). There is a great range of velocities, but most atoms are moving at velocities of hundreds of meters per second. For reference, an automobile moving at 100 km/hr (~60 miles/hr) is traveling a mere 28 m/s. Move the temperature slider in Figure 14a to see how the distribution of velocites changes as temperature is increased. At higher temperatures there is still a range of velocities, but more of the atoms are moving at the higher velocities.
Click on the "Show KE" button (right center) in Figure 14a to see the distribution of kinetic energies among the molecules of a gas in Figure 14b. Click on the "Show %" button and move the temperature slider in Figure 14b and you will see that both the average kinetic energy (3 ⁄ 2 R T) and the percentage of gas molecules above the selected minimum kinetic energy bound of 10000 J/mol increase as the temperature increases.
These observations have implications for the rates of petrologic processes. As temperature rises, motions/vibrations of atoms in minerals and magmas increase in magnitude and energy. As temperature rises, the rates of many petrologic processes increase dramatically. These effects are related.
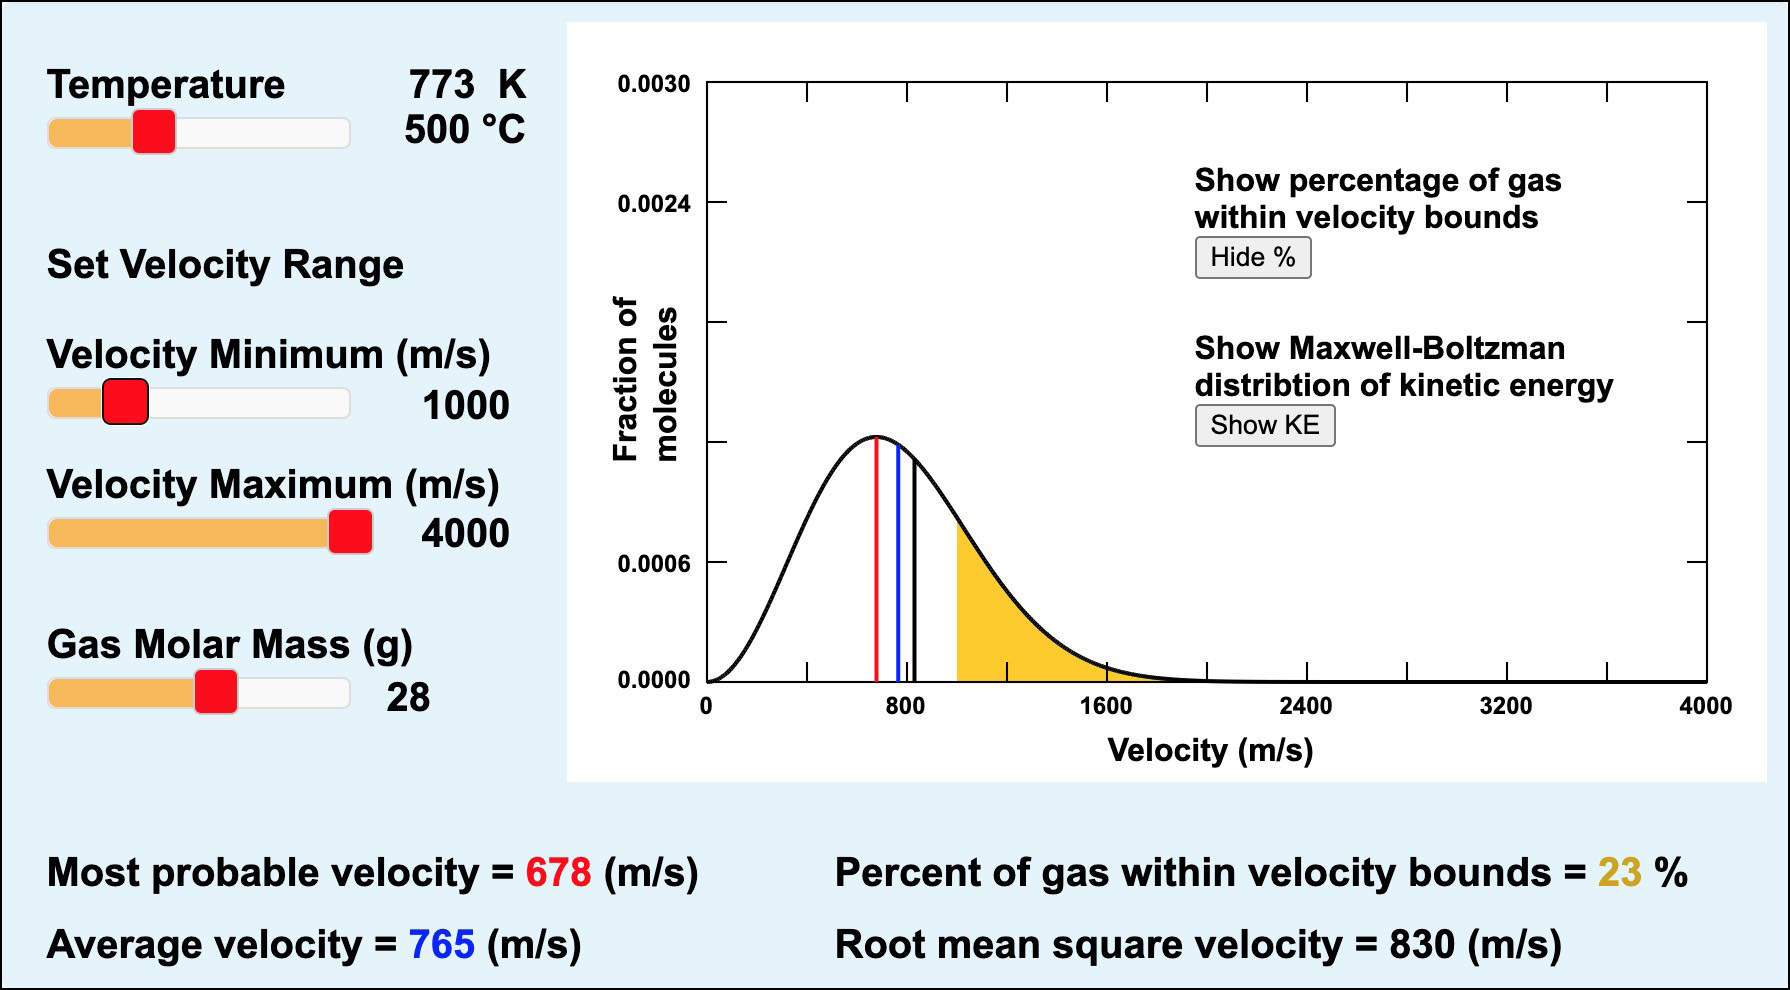
Figure 14a. The Maxwell-Boltzmann Distribution of the kinetic energies of ideal gas molecules at equilibrium. This figure shows statistical probabilities that gas molecules will have particular kinetic energies based on the kinetic theory of gases. Click on the image to see a larger version with more information and a link to Figure 14b.