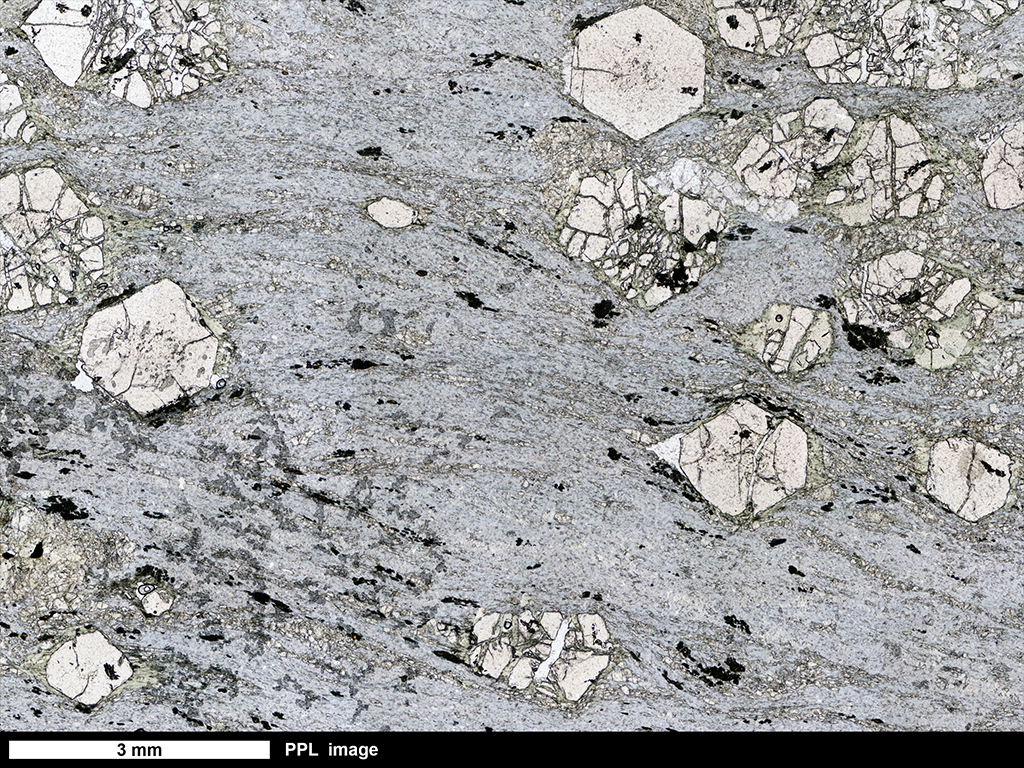
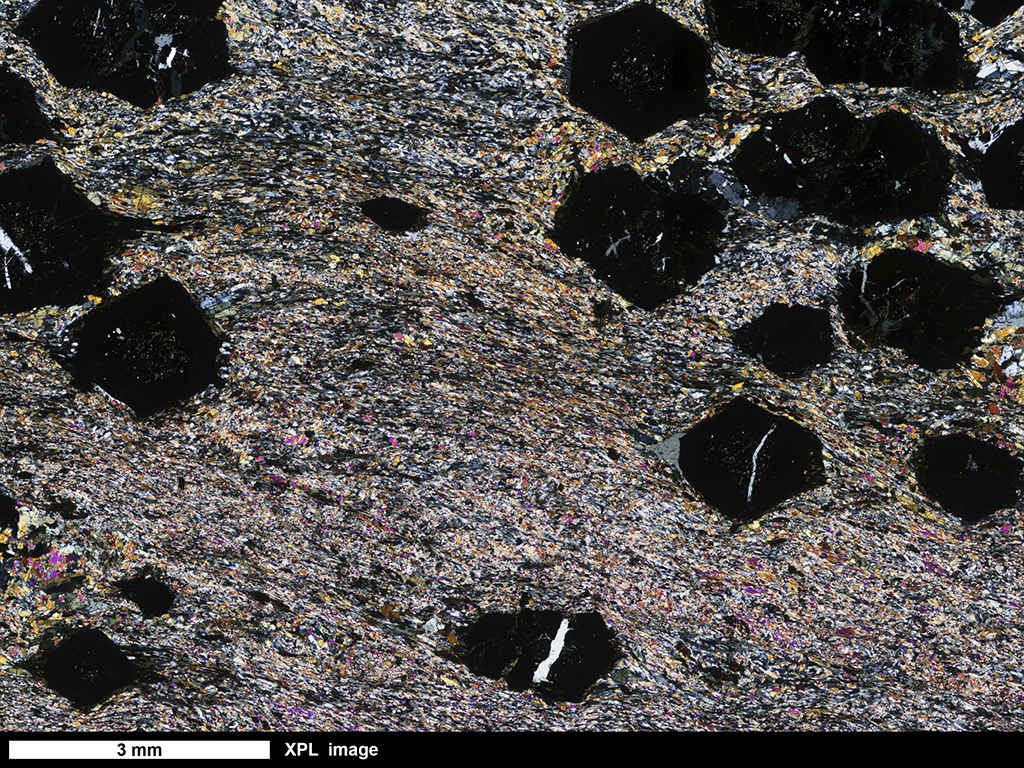
Use the radio buttons on the sidebar to choose two images to compare from the library for Rock 017. Move your mouse over the images to drag the boundary to the left or right. Boundary movement will let you compare in detail the two images and identify relationships among the features in the images. The images labeled PPL and XPL are petrographic microscope images. The images labeled Map are SEM/EDS element maps of the same thin section. The Phase Map is an interpretive map of the minerals present in the thin section based on the SEM/EDS spectra. Press the "Return" button to go back to the main Rock 017 entry. If you choose the Phase Map there from the Images pulldown menu on the sidebar, you will be able to see the identities of the minerals when you move the mouse over the Phase Map.