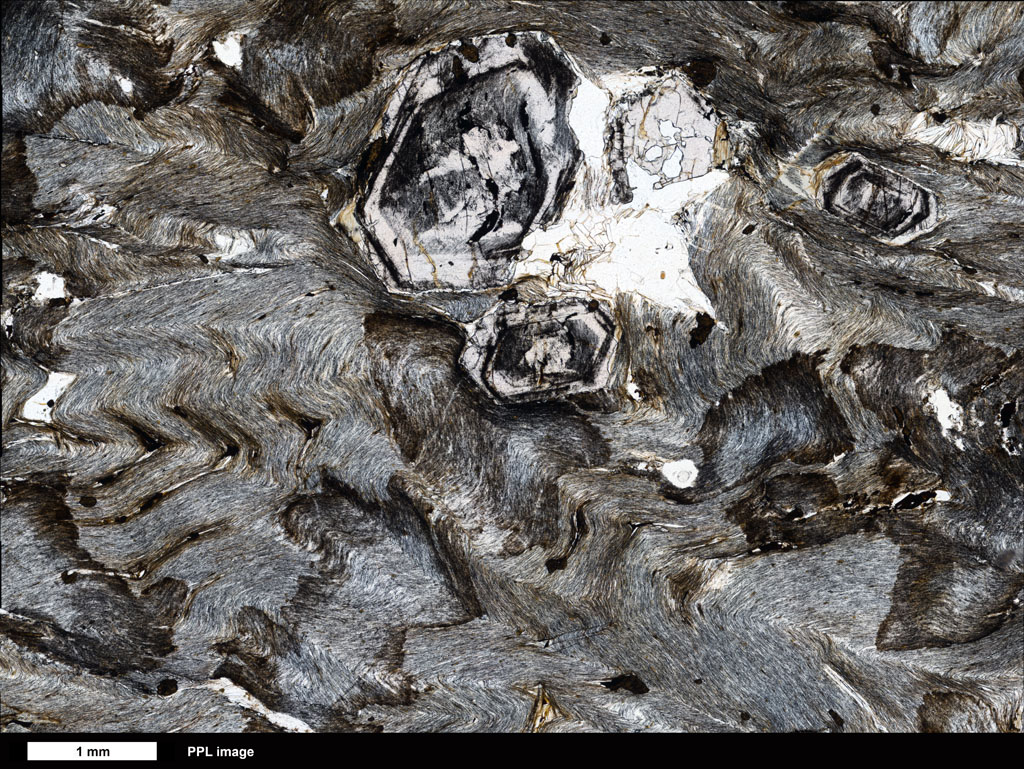
Figure 6.17. Grt-Chl Schist. Schist from SE Vermont, USA with garnet porphyrobasts that show graphite-rich inclusion bands. Click on the image to see a larger version.

Figure 6.18. Clockwise P-T Path. Idealized sequence of pressure (P) and temperature (T) conditions experienced by a metamorphosed sedimentary rock. Click on the image to see a larger, interactive version.
6.8 Pressure-Temperature Paths
Shales are deposited on the Earth's surface. Metamorphosed shales, like the Grt-Chl Schist in Figure 6.17, have been buried several kilometers and heated several hundred degrees to produce the observed mineral assemblages. However, if we can hold the metamorphosed shale in our hands, it has been transported back to the Earth's surface for us to find it. To become a schist, the shale has experienced a range of temperature and pressure conditions. Which of these conditions is recorded as an equlibrium mineral asseblage in the metamorphic rock?
Figure 6.18 shows an idealized pressure-temperature (P-T) path for a metamorphosed sedimentary rock, from protlith mud to schist outcrop. Thermal models of regional metamorphism due to tectonic thickening of the crust predict that pressure is likely to rise during a continent-continent collision more rapidly than temperature rises, as shown in Figure 6.18. The rock experiences its maximum pressure when the crust is thickest, but temperature continues to rise even as erosion begins to reduce the pressure. From the maximum temperature point, both T and P fall as erosion, tectonic movement, or both eventually bring the rock back to the surface. From the trajectory of this path on a T-P diagram, a path like the one in Figure 6.18 is said to be a clockwise P-T loop.
If a metamorphic rock has experienced many P-T conditions, at what point on the P-T path are metamorphic reactions likely to stop? Why don't all metamorphic rocks have low grade assemblages that form as their P-T path passes through low temperature conditions on its way to the surface? A reasonable answer to these questions is based on the fact that many metamorphic reactions are dehydration reactions. The water released by those reactions is mobile and leaves the metamorphic rock by diffusion and fluid flow. As the metamorphic rock cools, it lacks the water needed for the hydration reactions that would return it to a low grade assemblage. Therefore, it is the maxiumum temperature (driest) conditions that are likely to be recorded, producing the metamorphic zones observed today in the field. Click on Figure 6.18 and click the "Other Paths" button on the upper right to see maximum T conditions for other rocks in the metamorphic sequence that are not buried as deeply as those on the visible path. Then click on the "Show Facies" button to see those maximum T points connected to make a metamorphic field gradient.
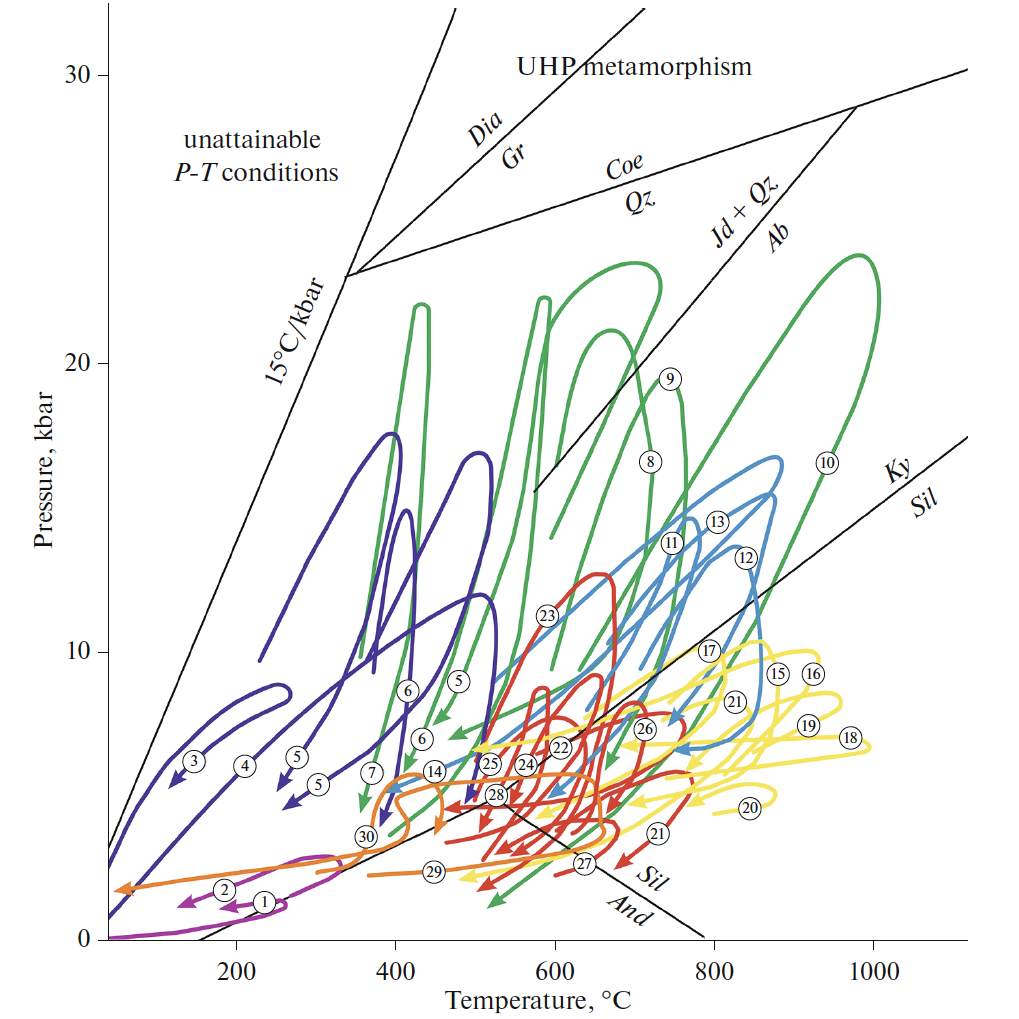
Figure 6.19. PT Path Samples. Click on the image to see a larger version of these paths and their sources in Likhanov (2020).
If each rock in a metamorphic terrane records only one point on a P-T path, how is it possible to determine a whole P-T path for a rock instead of just a collection of maximum temperature conditions for the terrane (the metamorphic field gradient)? What information is needed to determine a P-T path?