We saw in Figure 6.05 that, in the two-component H2O-C12H22O11 system at 1 bar pressure, the weight percent C12H22O11 in sugar-saturated water varies with temperature.

Figure 6.12. H2O-NaCl-KCl Diagram at 20°C. Click on the image to see a larger version.
The brine example demonstrates that the equilibrium composition of a phase in terms of one component, may depend on the other components in the phase. This is true for solid solution minerals that occur in metamorphic rocks. To use mineral compositions in a geothermometer based on chemical equilibrium, corrections should be made for the effects of all components on the equilibrium constant for the geothermometer reaction. For example, the Grt-Bt geothermometer experiments of Ferry and Spear (1978) used garnets that were Mg3Al2Si3O12-Fe3Al2Si3O12 (Pyp-Alm) solid solutions. Natural garnets are likely to have significant proportions of Ca3Al2Si3O12 (Grs) and Mn3Al2Si3O12 (Sps), which should be considered to get more accurate equilibrium temperatures.
The details of developing thermodynamic solution models for minerals are beyond
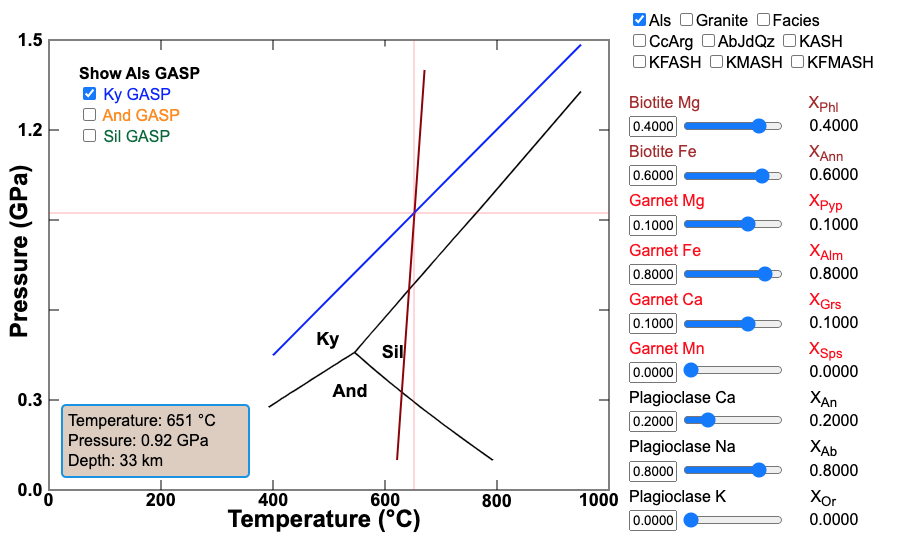
Figure 6.13. GrtBi-GASP Geothermobaro-meter of Hodges and Spear (1982). Click on the image to see a larger animated version where you can enter composition data and see the effects on the geothermobarometer.
Due to the complexity of solid solution minerals, geologists are still trying to refine the thermodynamic solution models that are needed for accurate equilibrium geothermometry and geobarometry. Papers that provide new data and/or attempt to improve the models for specific thermometers or barometers continue to appear in the geologic literature (e.g. Beyer et al., 2015; Ferry and Watson, 2007; Holdaway, 2001). However, with advances in computer technology, petrologists have developed software that can assess equilibrium conditions using thermodynamic models for all of the minerals in the mineral assemblage of a metamorphic rock.