Locking Depth
While the locking depth has not been fully looked into, a brief comparison was done to determine the effects of a locking depths on all segments of 10, 15, and 20. The results are shown below:
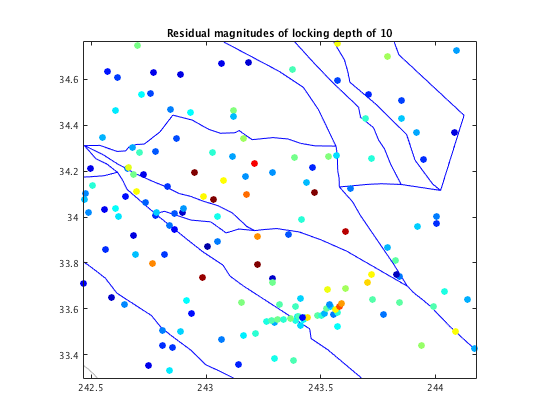
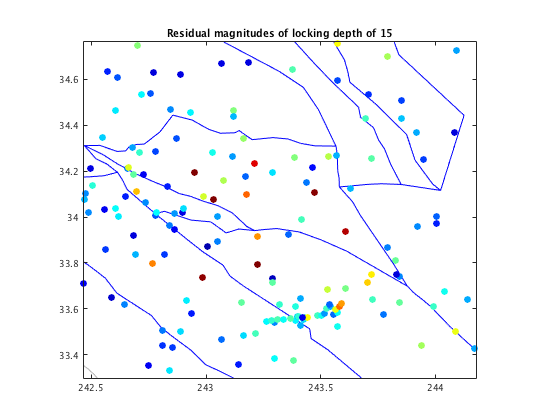
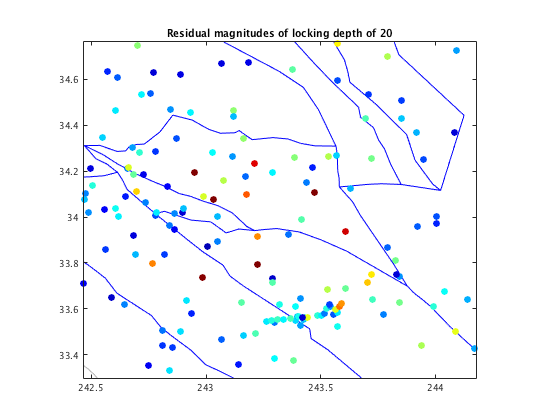
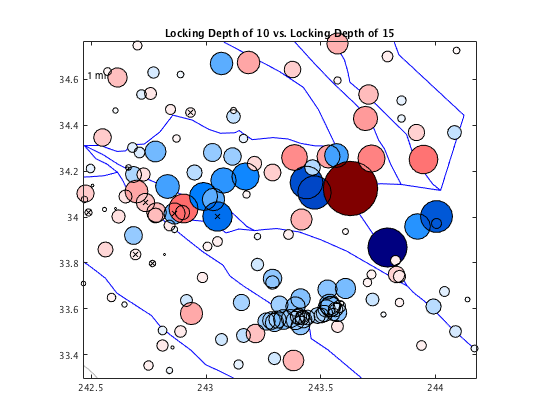
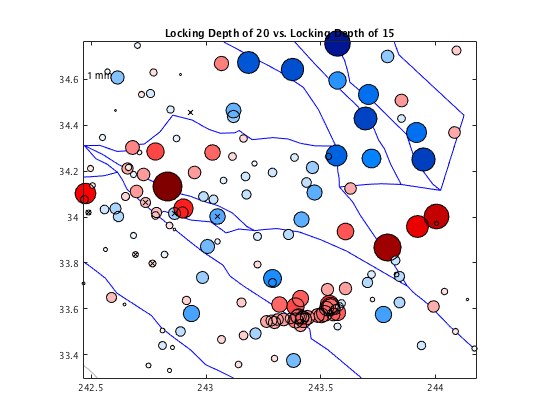
When comparing the different models, I looked at the residual magnitudes, the value we get when we take the difference of the modeled velocities from the observed velocities within that model, as well as the residual improvement between two different models. In the figures showing the residual magnitudes, the red dots represent bigger residual velocity vectors, hinting that the region in particular needs improvement, and the blue dots represent smaller residual vectors, meaning that the GPS velocities were well reproduced in that area.
The residual magnitudes between locking depths of 15 and 20 are the same, however those of a locking depth of 10 had worsened slightly in the western segments as well as in the San Bernardino segments closest to the study area.
I then compared the residual improvements between the two extremes (depths of 10 and 20) with the default (15):
Future runs will test locking depth in increments of 1 to be more restricting in order to narrow down the values.