Variations in strike of the western end
When constructing the San Gorgonio block, the question of how to “close” up the block in a geologically sensible way had become a reoccurring issue. With help from the SCEC Community Fault Model, the San Gorgonio block boundary began by tracing the Coachella valley segment of the Banning fault and continuing westwards to trace the irregular “sawtooth shaped” San Gorgonio thrust fault. However, the San Gorgonio thrust fault ends just short of the San Jacinto block boundary and the issue arose as to which direction the new fault segments connecting the San Gorgonio thrust fault to the San Jacinto block would go.
Would it make more sense to follow along the Banning fault and orient the new fault segments northwest as a result? Or would a more southwest trending fault be more appropriate in continuing the thrust fault’s irregular sawtooth trace? Both scenarios were tested as shown below:
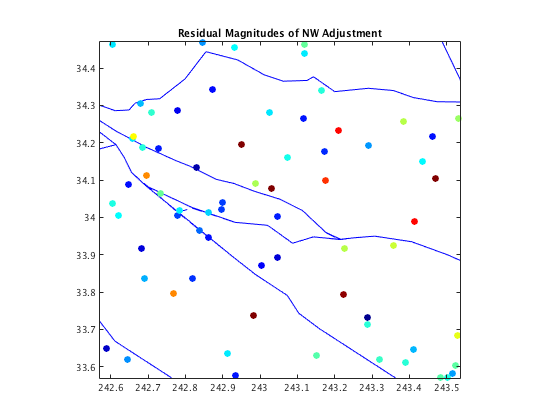

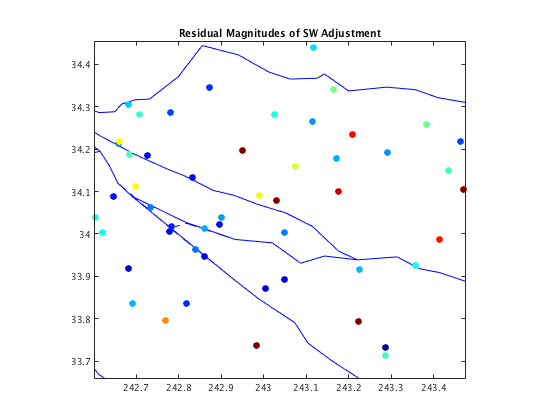
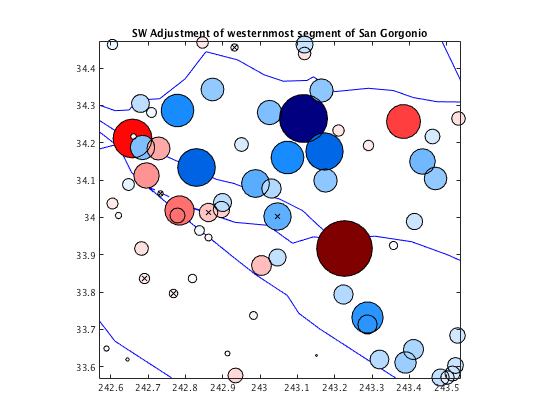
When comparing the different models, I looked at the residual magnitudes, the value we get when we take the difference of the modeled velocities from the observed velocities within that model, as well as the residual improvement between two different models. In the figures showing the residual magnitudes, the red dots represent bigger residual velocity vectors, hinting that the region in particular needs improvement, and the blue dots represent smaller residual vectors, meaning that the GPS velocities were well reproduced in that area.
The residual magnitudes of the NW vs SW adjustments for the Banning fault trace suggest that a SW orientation generates a better approximation of GPS velocities along the San Gorgonio thrust fault, especially concerning the GPS stations located in that particular area as well as the central part of the Pass, where the San Gorgonio thrust fault merges with the Banning fault. There one can see a distinct difference between the NW and SW models. However, we can also see that while the residual magnitudes along the San Gorgonio thrust seem to have improved with a SW orientation on the western end, the residual magnitudes in the surrounding area (in the San Bernardino Mountains and in the San Jacinto Mountains) seemed to have worsened. This can be shown in the figures below, depicting the residual improvement between the two models:
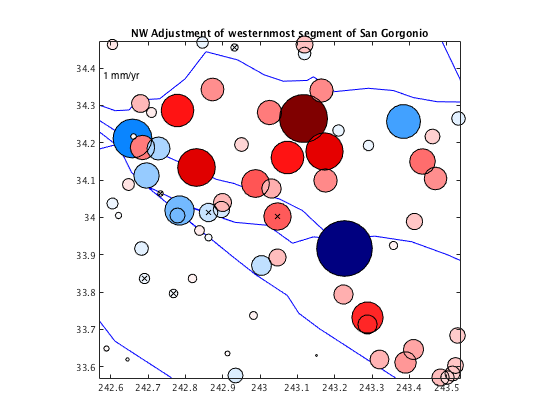
NW orientation vs. SW orientation (Red = improvement; Blue = worsening)
SW orientation vs. NW orientation (Red = improvement; Blue = worsening)
From these figures, we can deduce that a SW orientation on the westernmost fault segment does in fact reproduce GPS velocities along the study area better than the NW orientation, but additionally worsen the surrounding area. Because this study is focused on the San Gorgonio Pass, the SW model was further used for tests on dip and locking depth.