8.0 Fractional Crystallization Figures List
-
- Figure 8.00. Moon from Vermont Interactive: zoom and pan with mouse
-
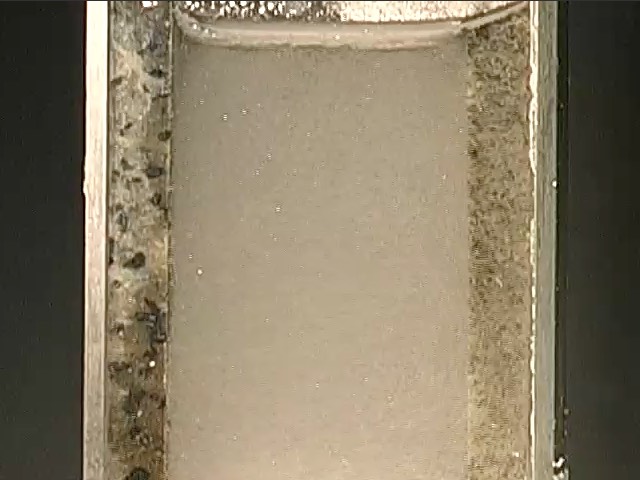
- Figure 8.01. Sylvite Crystal Settling Movie Interactive: video
-
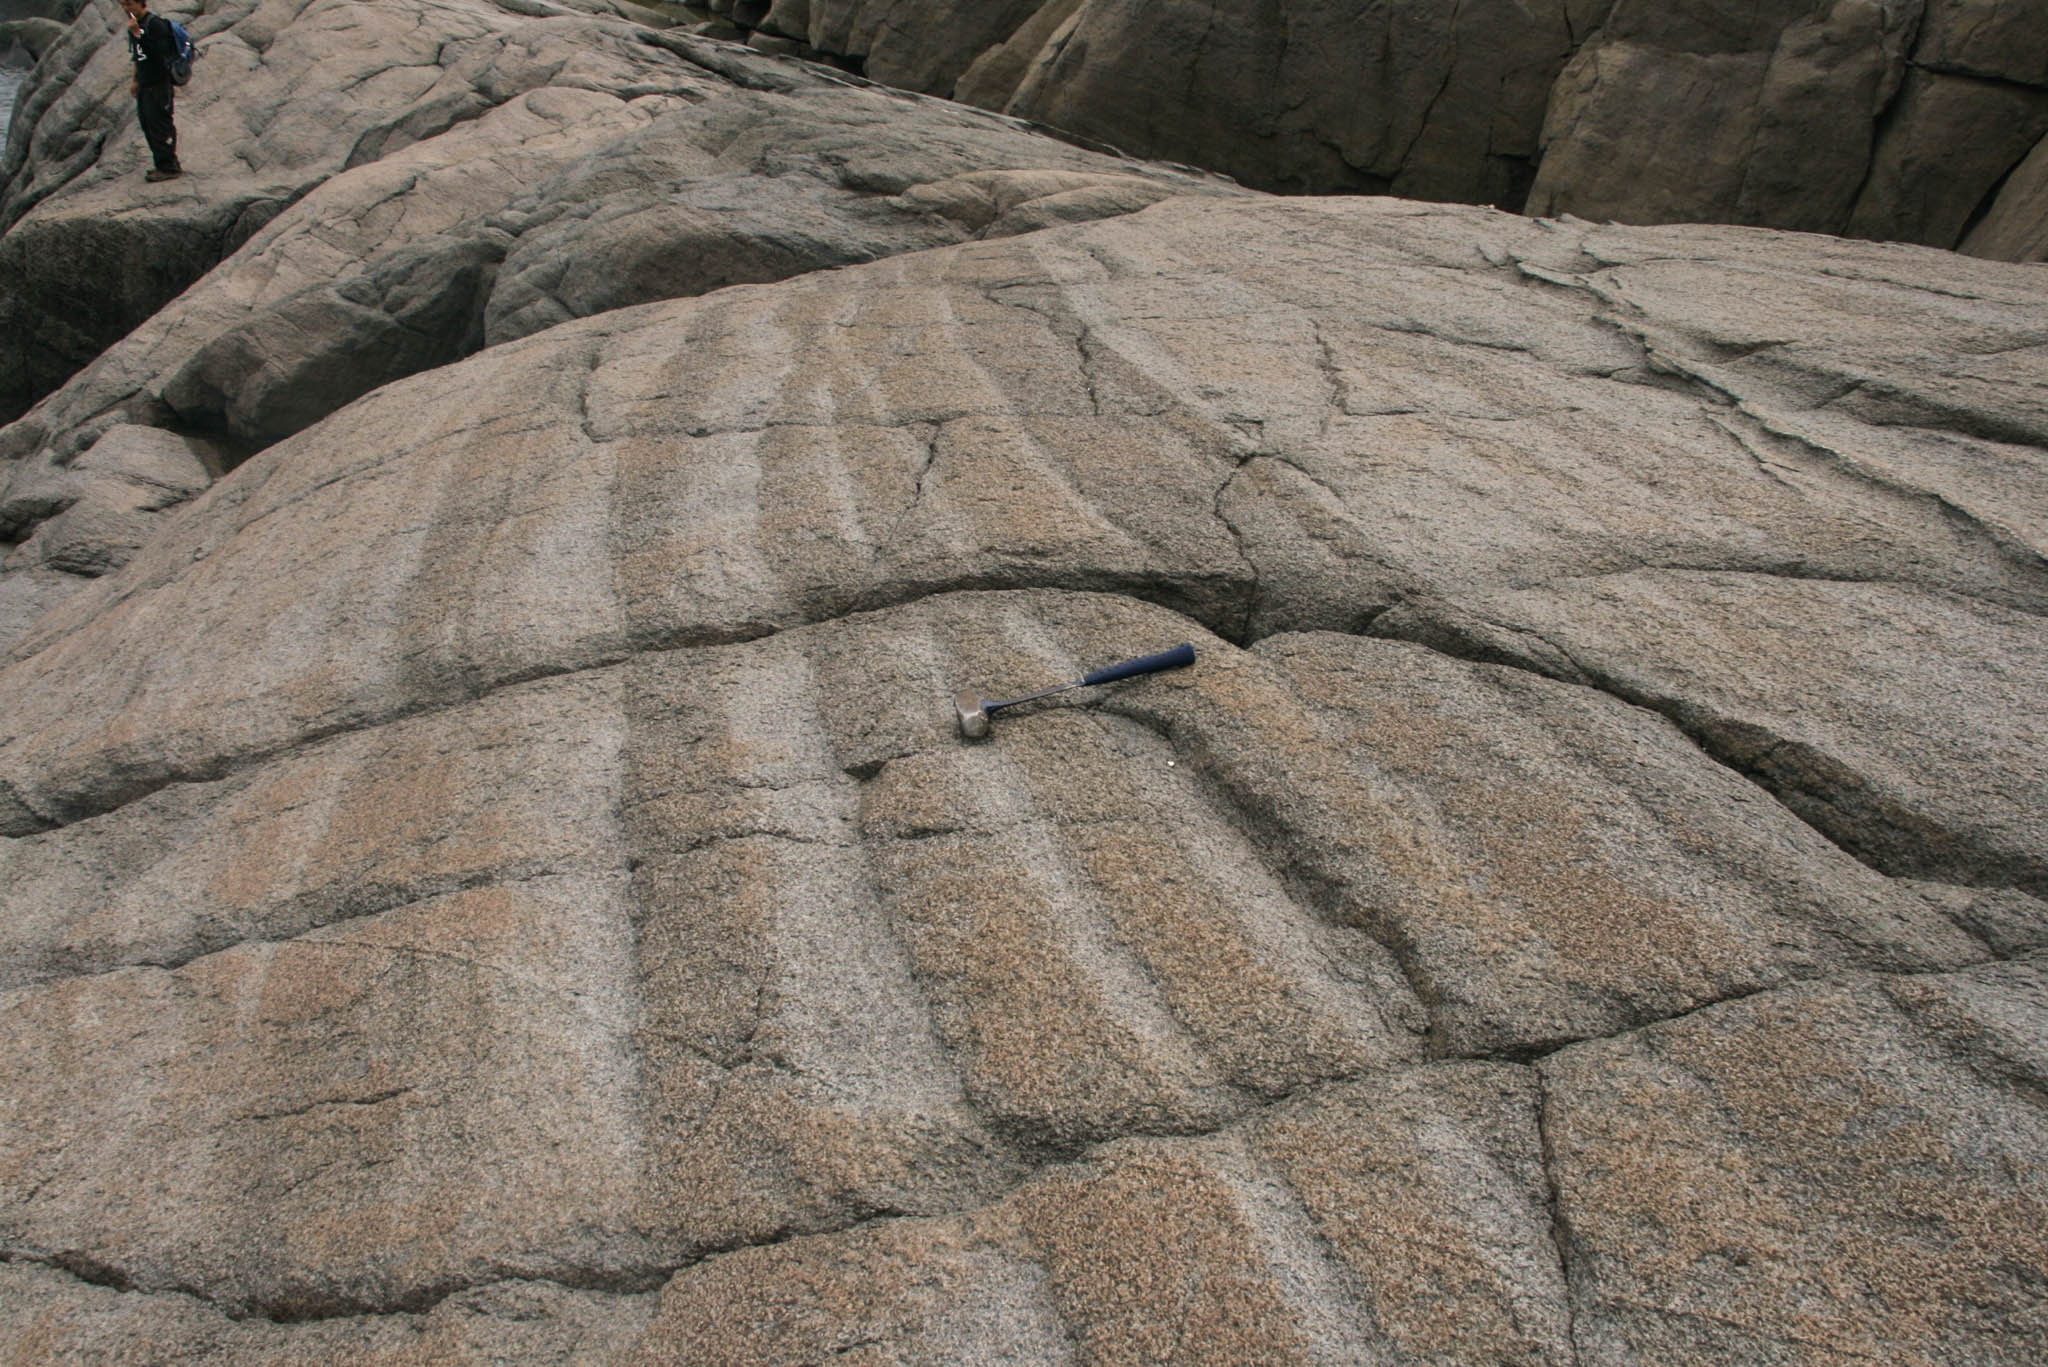
- Figure 8.02. Igneous Layering (Kiglapait) Interactive: zoom and pan with mouse
-
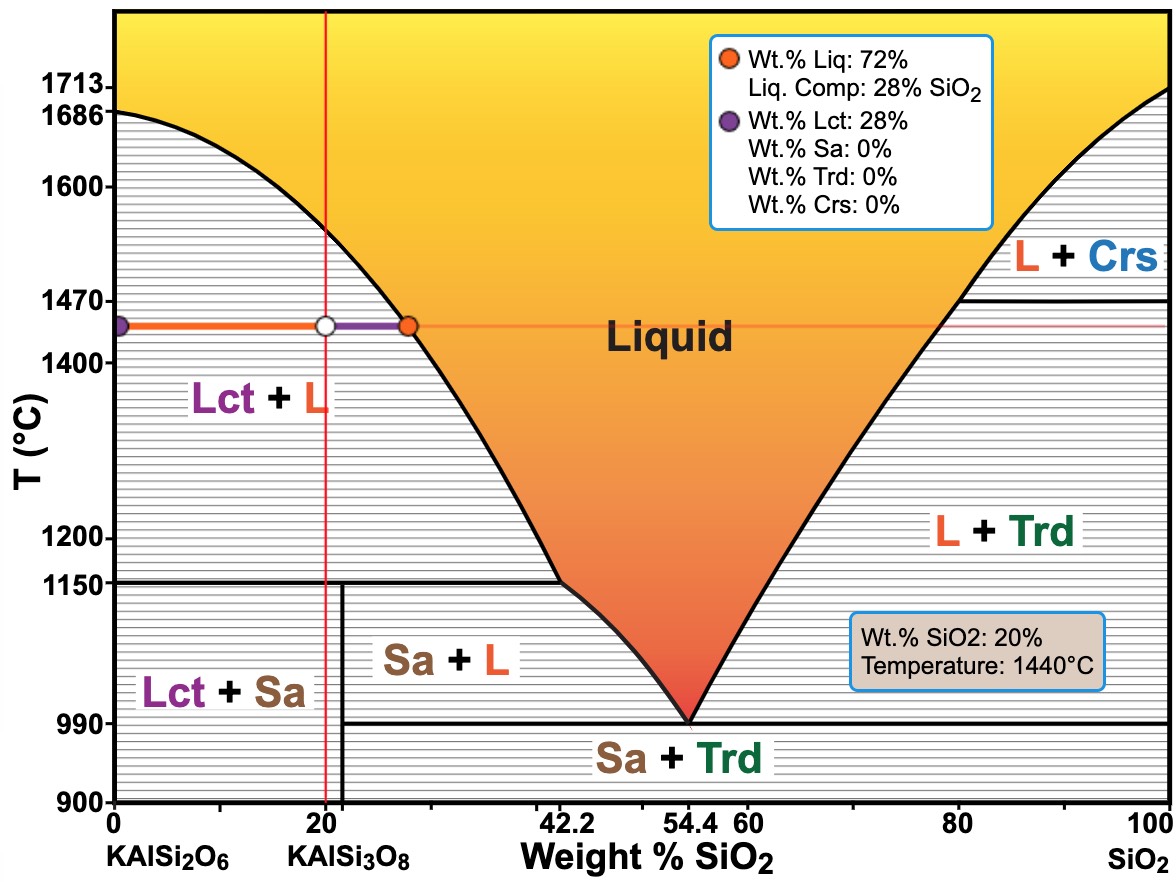
- Figure 8.03. Leucite-Silica Equilibrium Diagram Interactive: button and mouseover to show
phase compositions and percentages -
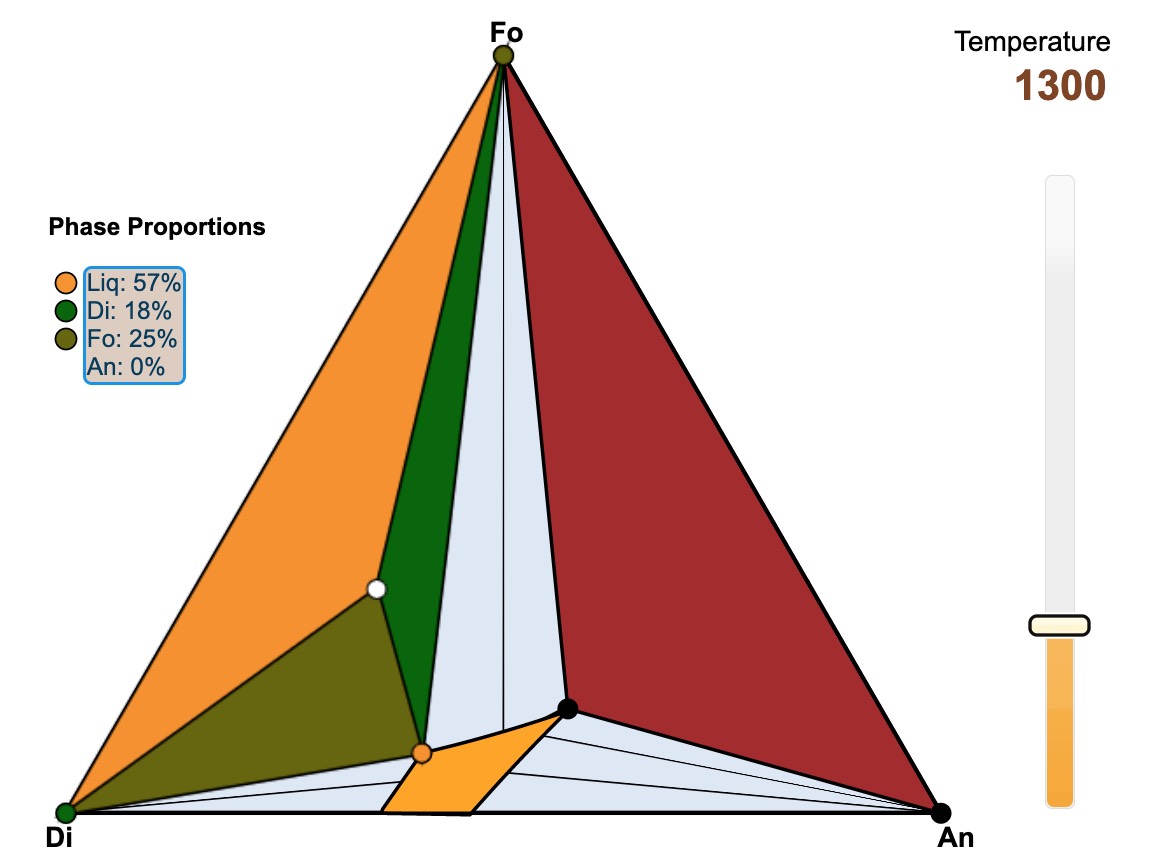
- Figure 8.04. Di-FoAn Liquidus Diagram Interactive: temperature slider and mouseover
to show phase compositions and percentages -
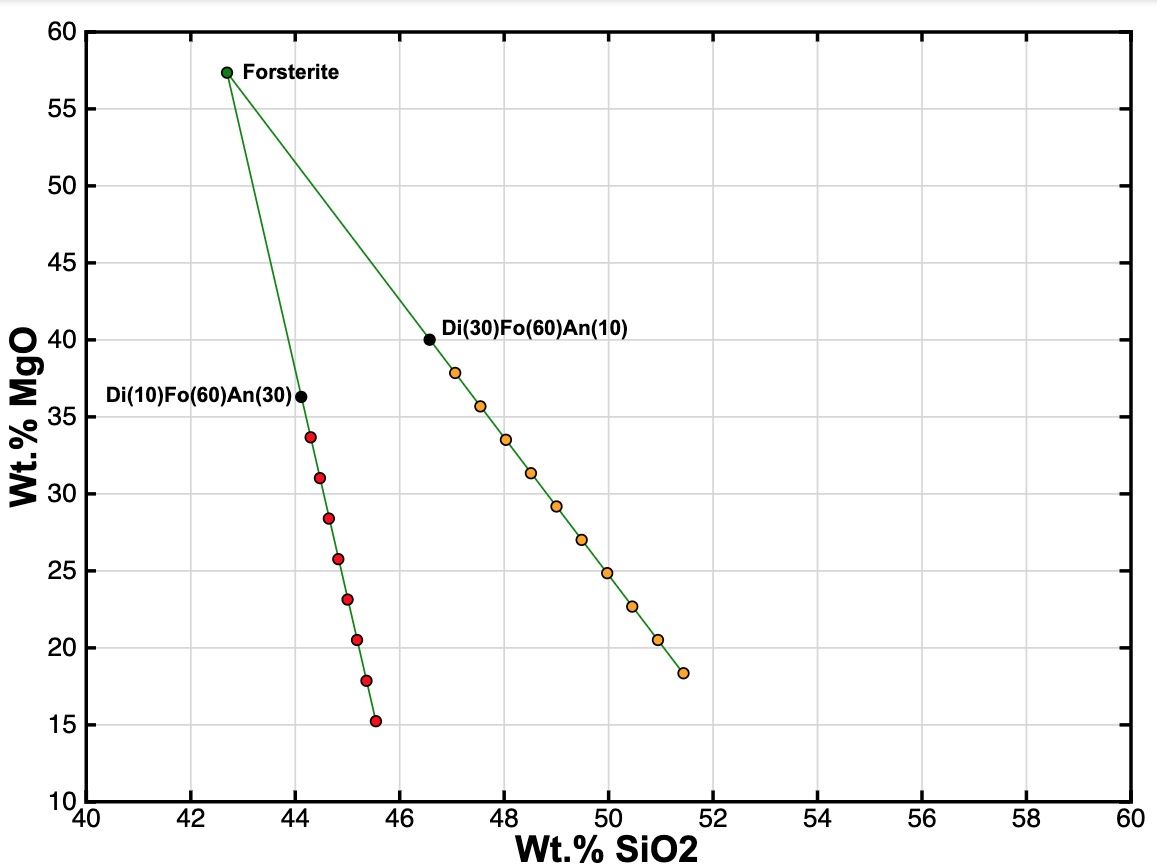
- Figure 8.05. MgO vs. SiO2 Shows Fo Fractionation Interactive: buttons to show composition changes
and to switch variation diagrams -
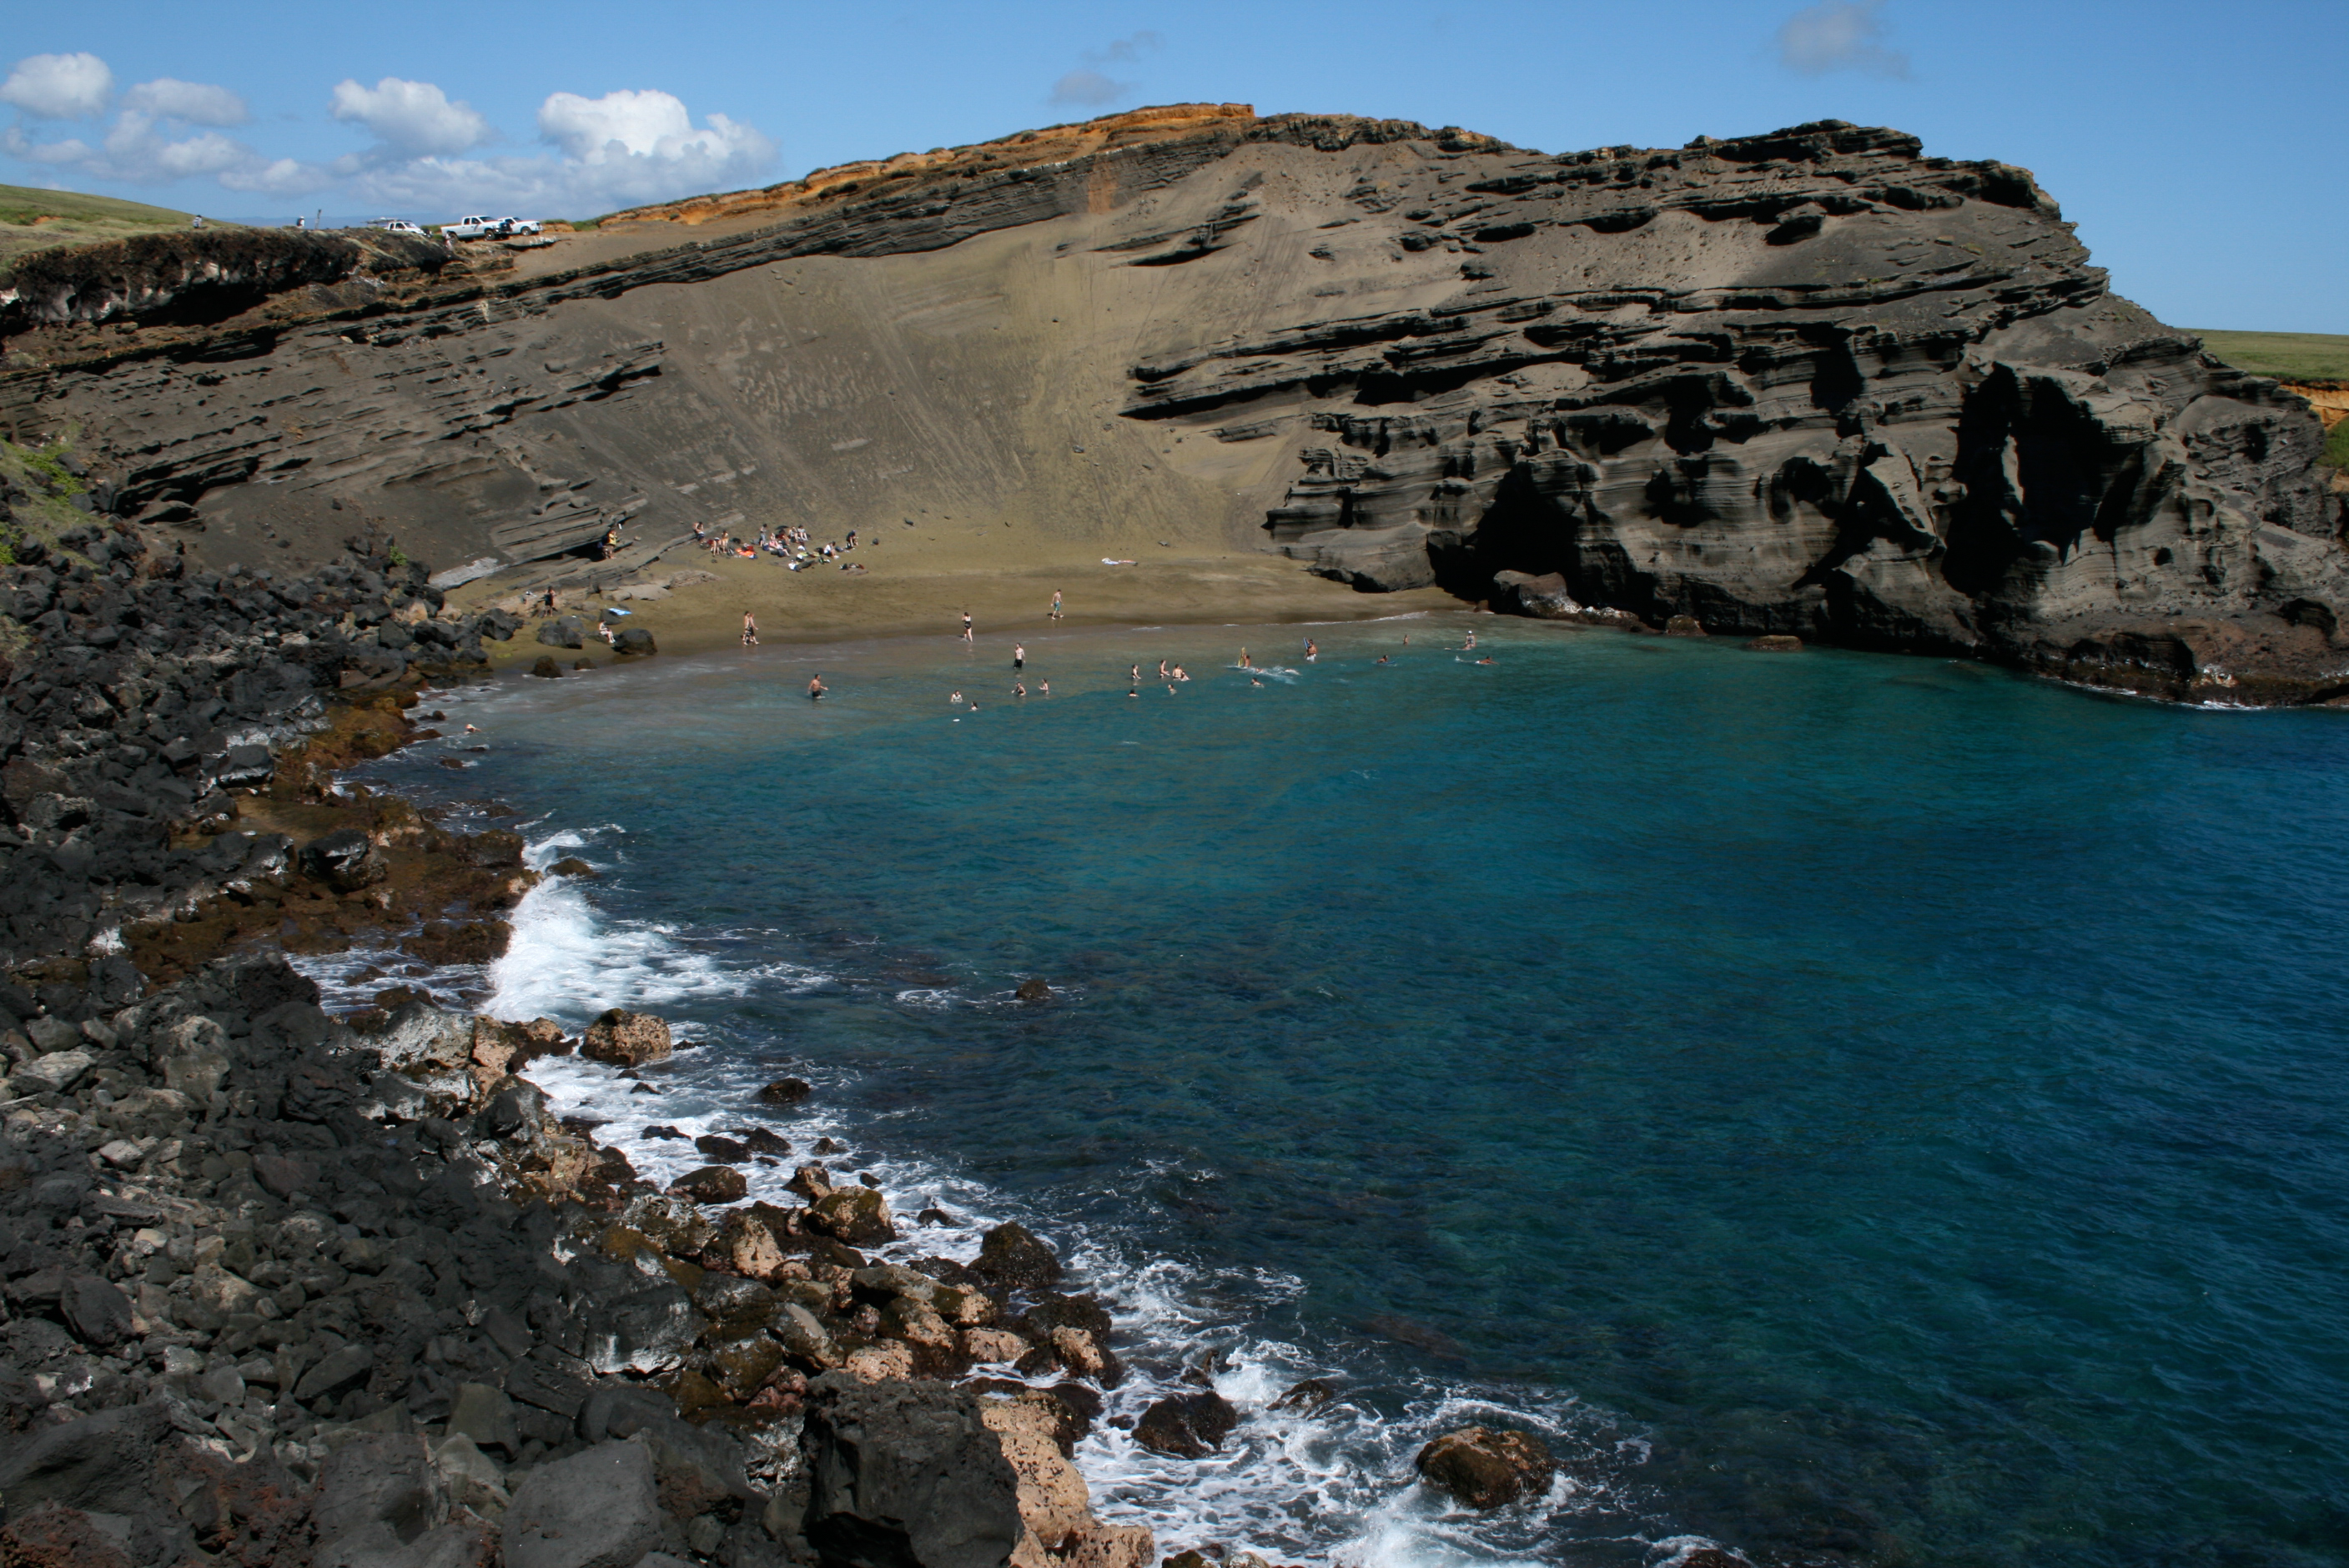
- Figure 8.06. Green Sand Beach, Hawaii Interactive: zoom and pan with mouse
-
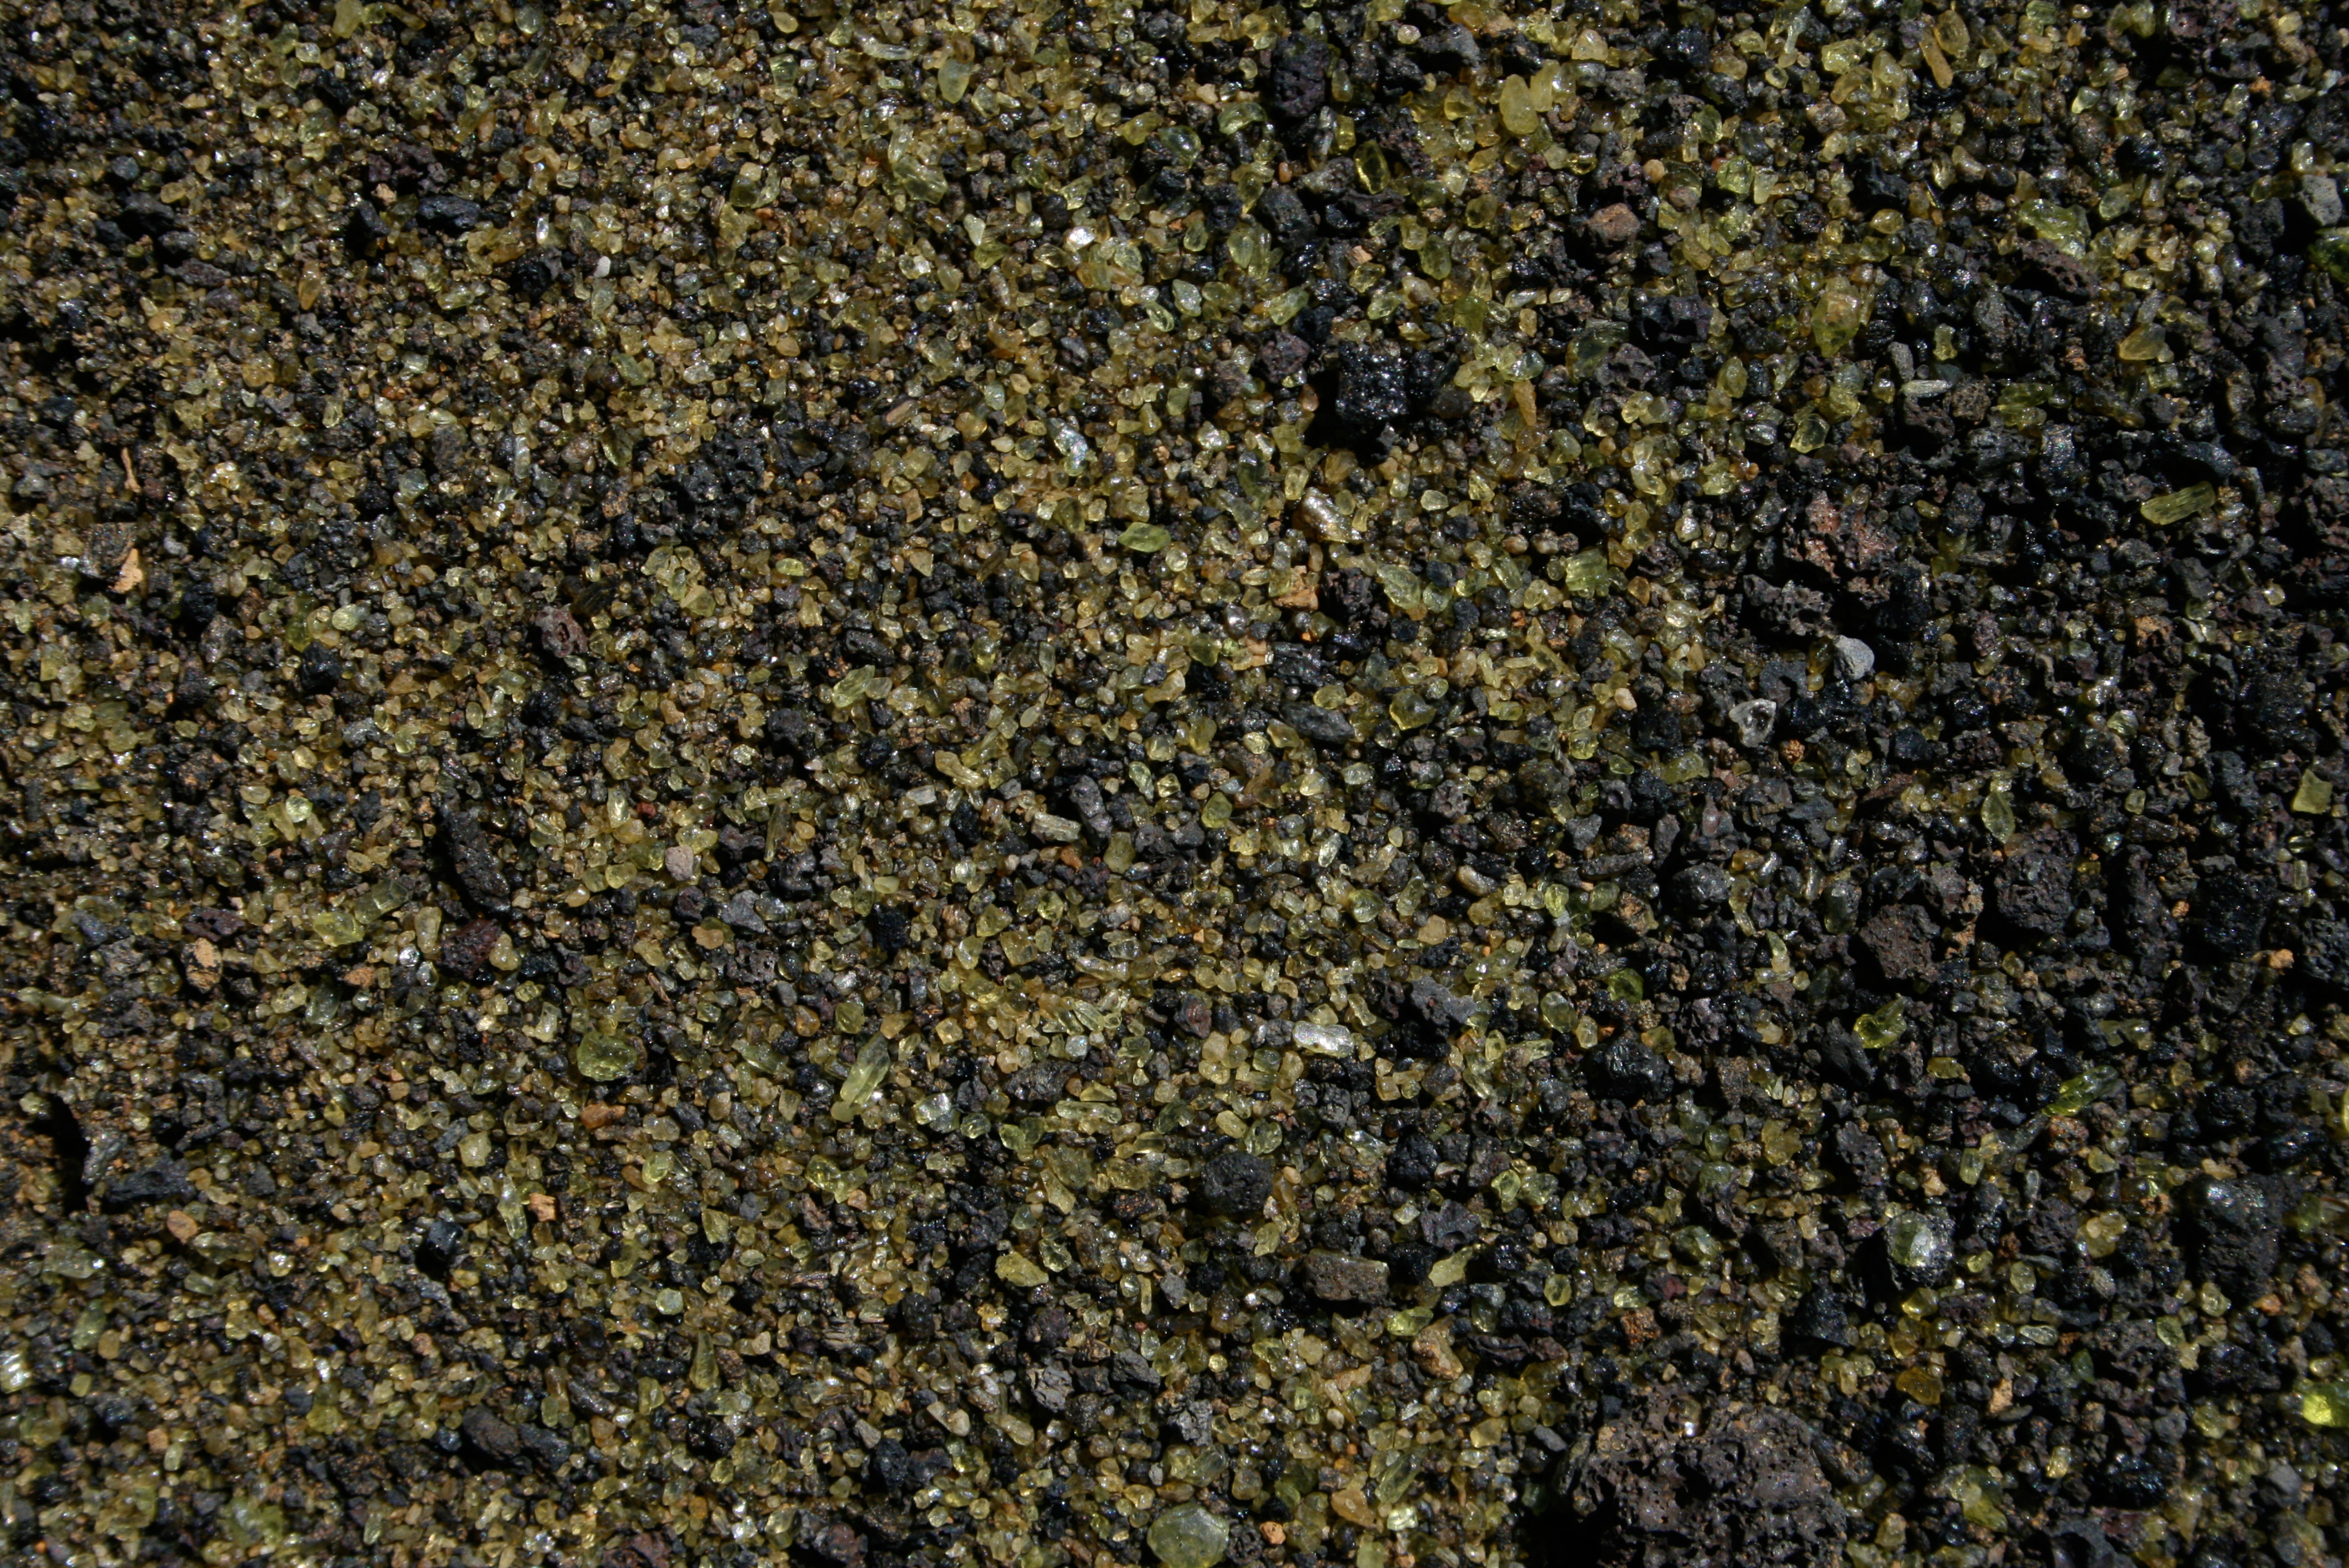
- Figure 8.07. Closeup View of Olivine Sand Interactive: zoom and pan with mouse
-
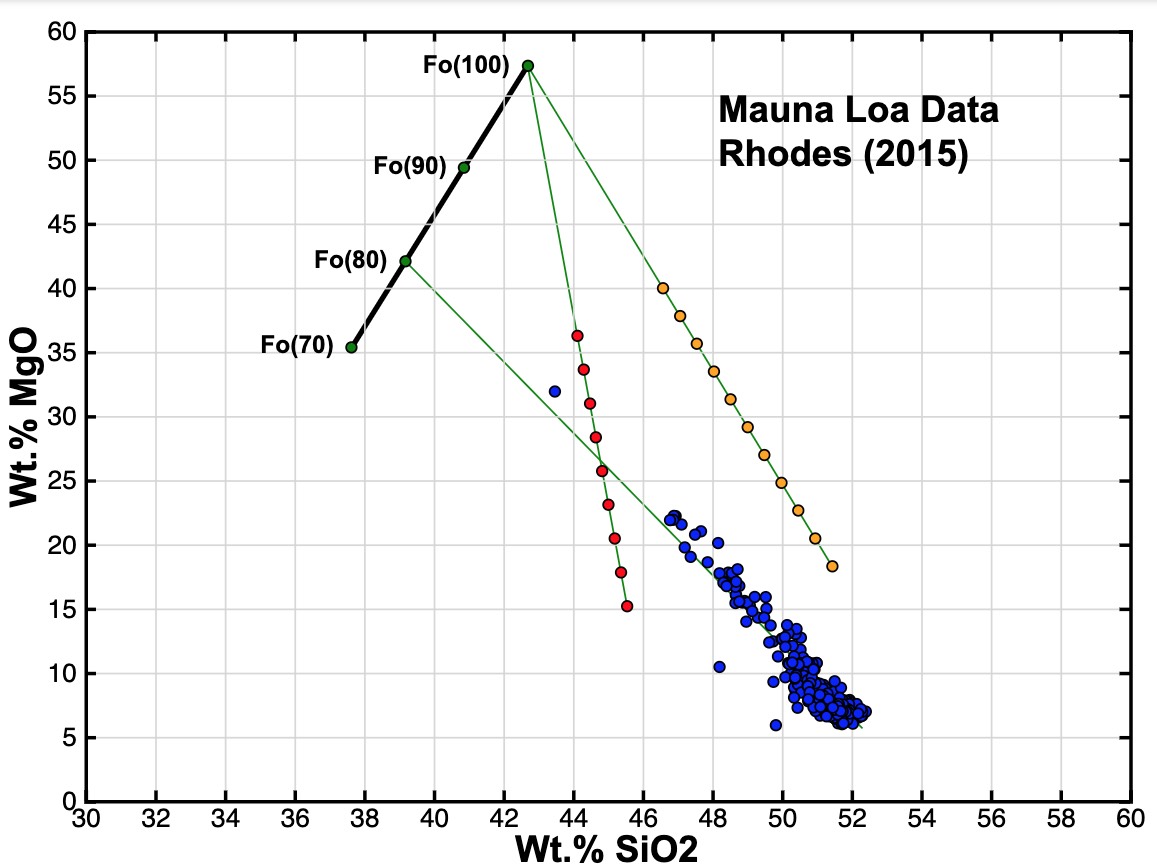
- Figure 8.08. Mauna Loa Fo Fractionation Interactive: buttons to show composition changes
and to switch variation diagrams -

- Figure 8.09. Comparison of Igneous Data Sets Interactive: zoom and pan with mouse
-
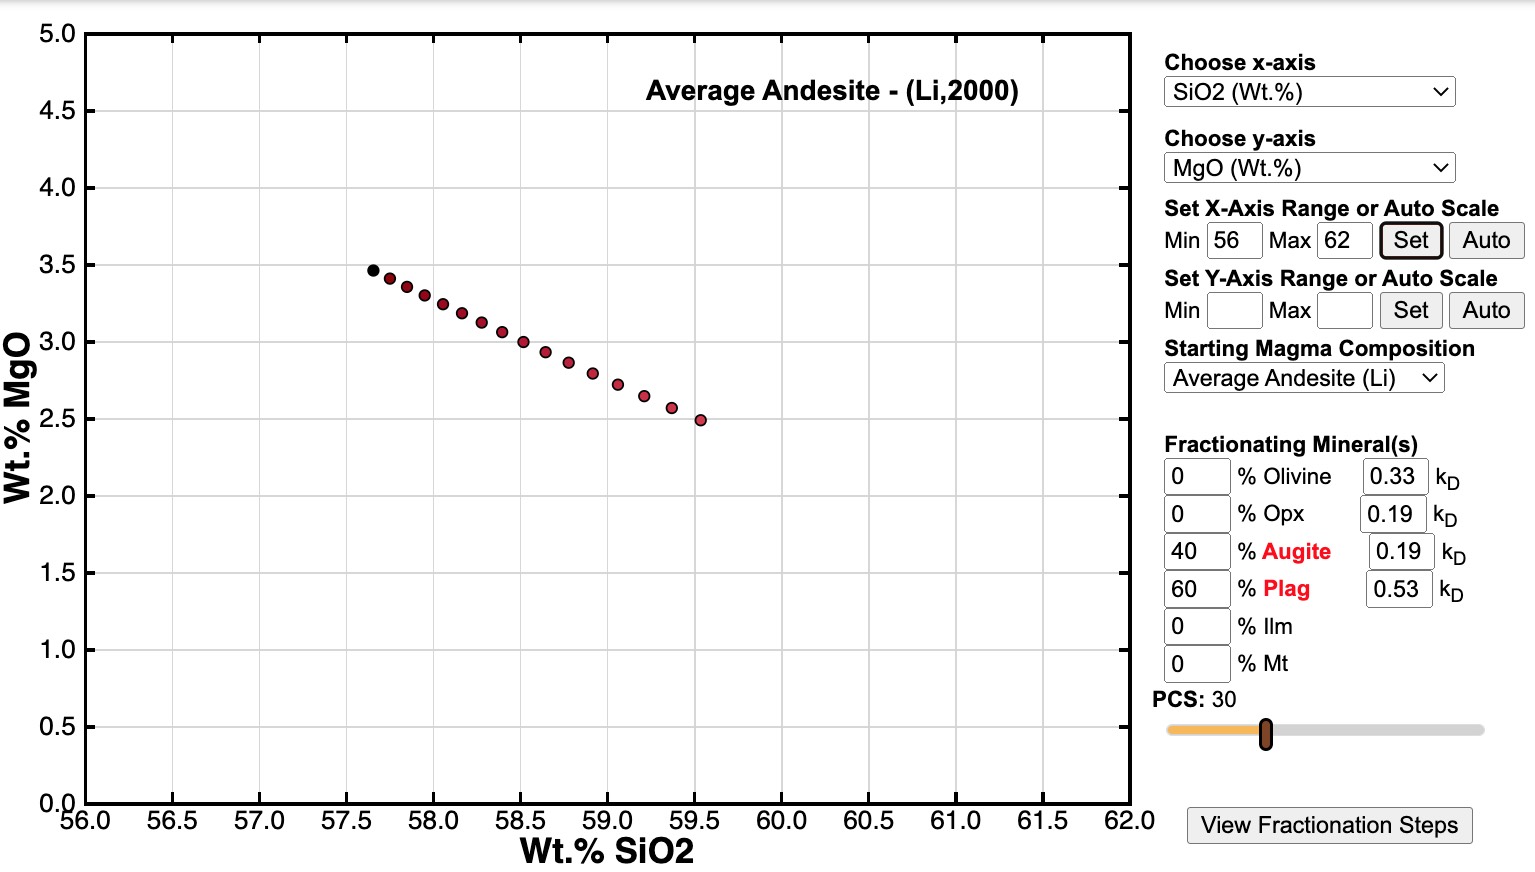
- Figure 8.10. Fractional Crystallization Model Interactive: chose starting composition, minerals,
proportions, KDs, oxides to plot, and scale,
then change percent solidified with slider
-
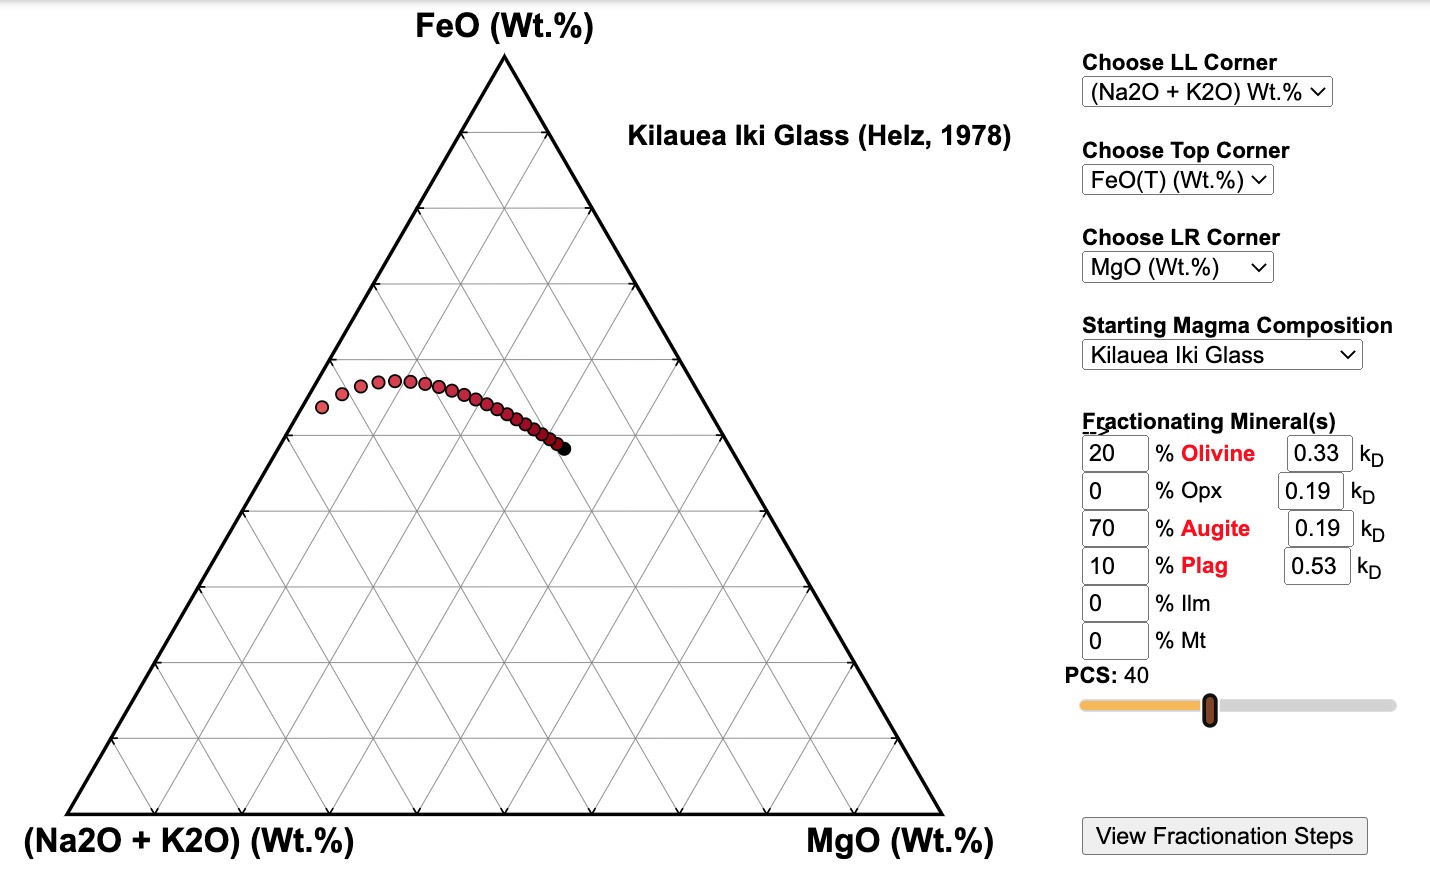
- Figure 8.11. Ternary Fractional Crystallization Model Interactive: chose starting composition, minerals,
proportions, KDs, and oxides to plot,
then change percent solidified with slider