2.0 Gibbs Energy Figures List
-
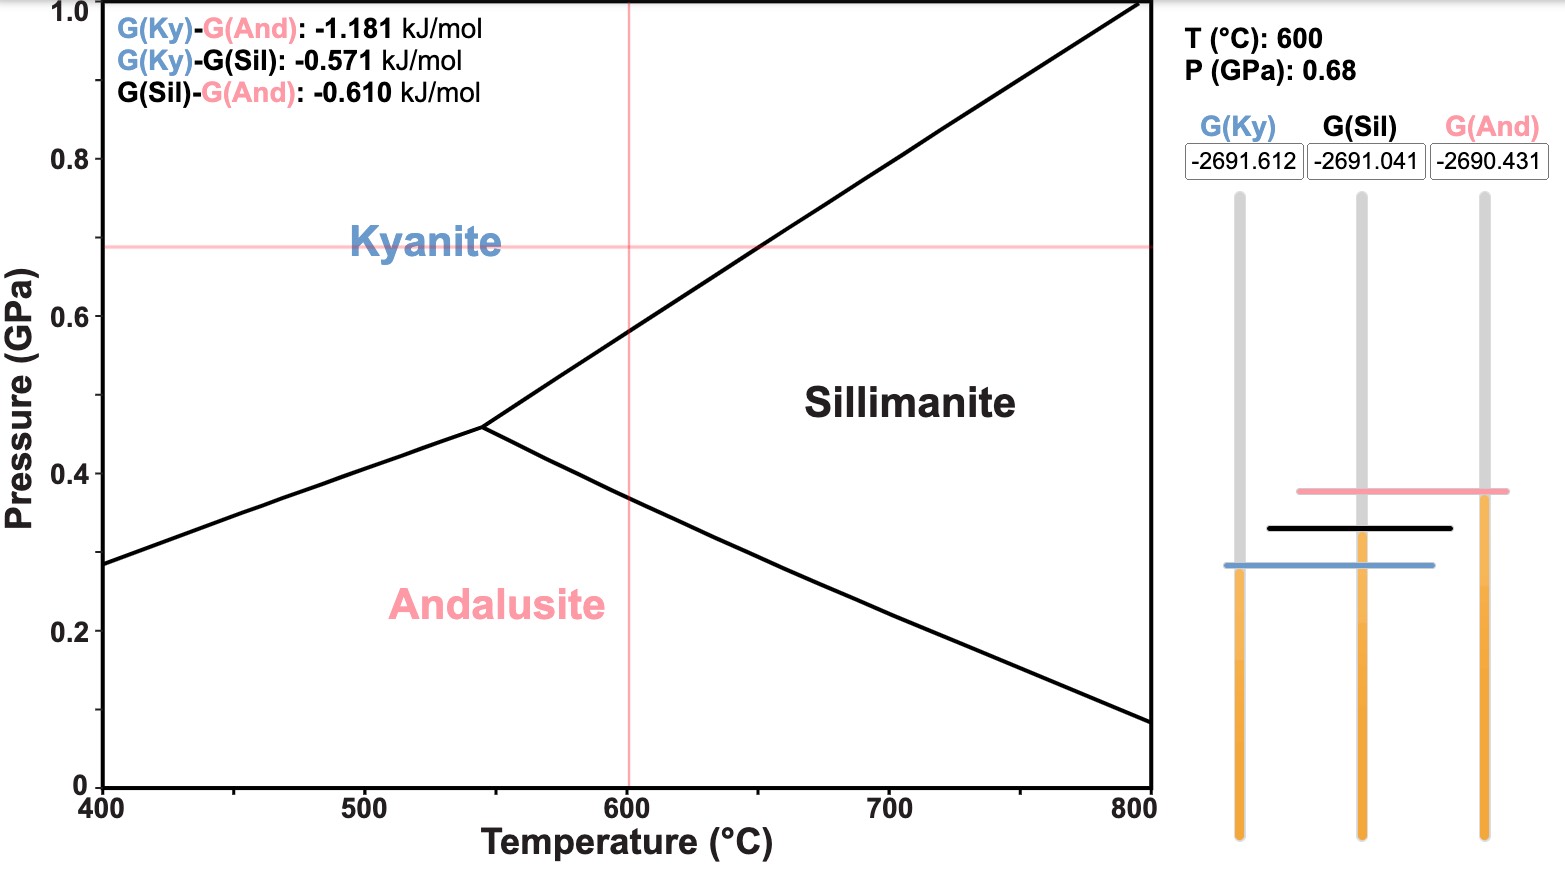
- Figure 1.01. Aluminosilicate stability diagram Interactive: mouseover to show Gibbs energies, ΔG,
and button make scale relative -
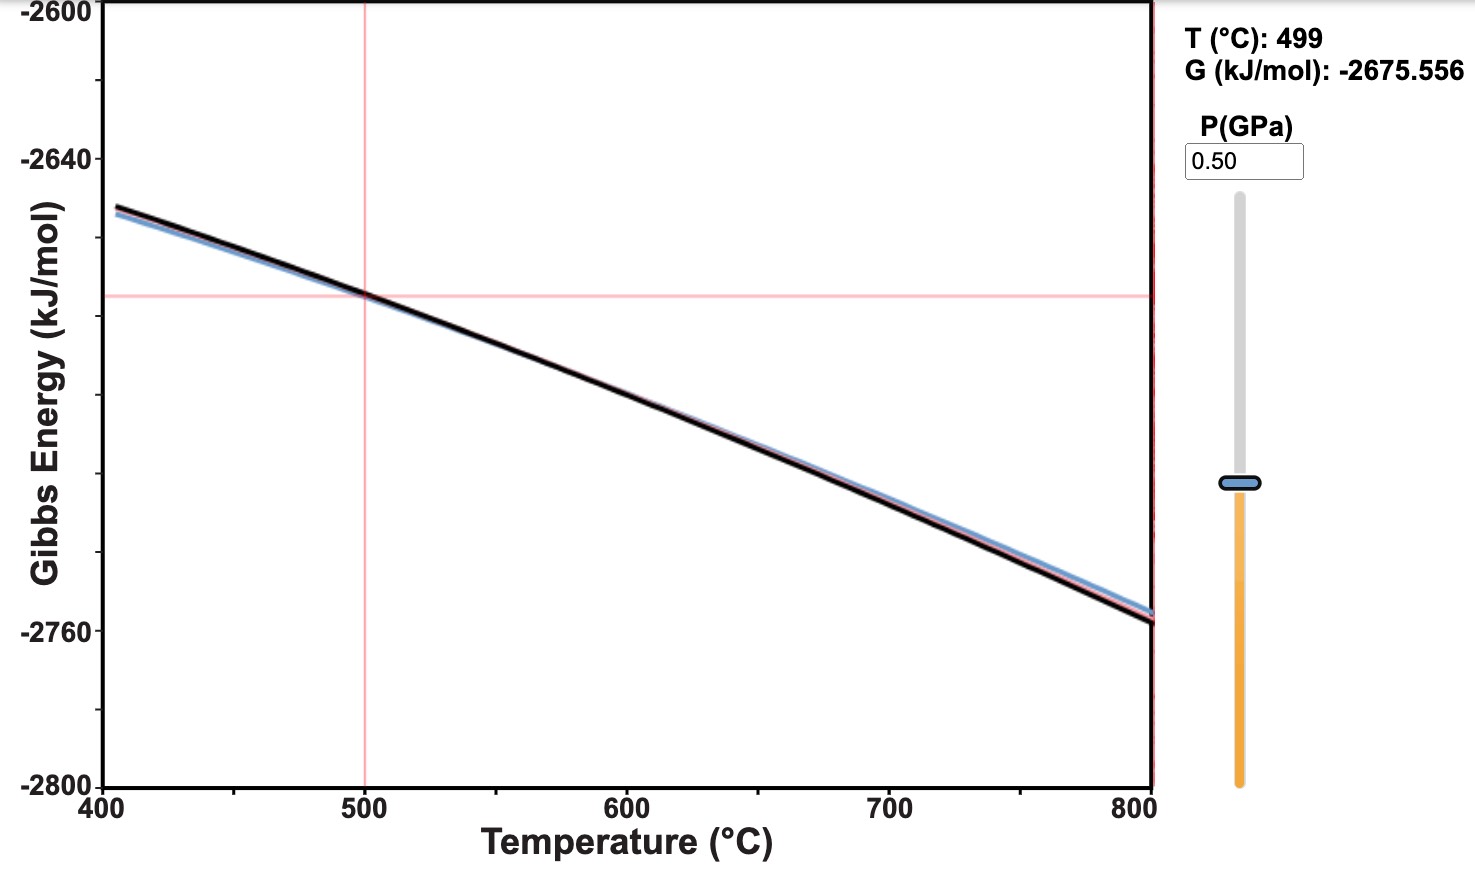
- Figure 1.02. Als G vs. T Diagram Interactive: slider to change pressure
-

- Figure 1.04. Schematic G-X-X Diagram Interactive: slider to change temperature and
show reactions change assemblages -
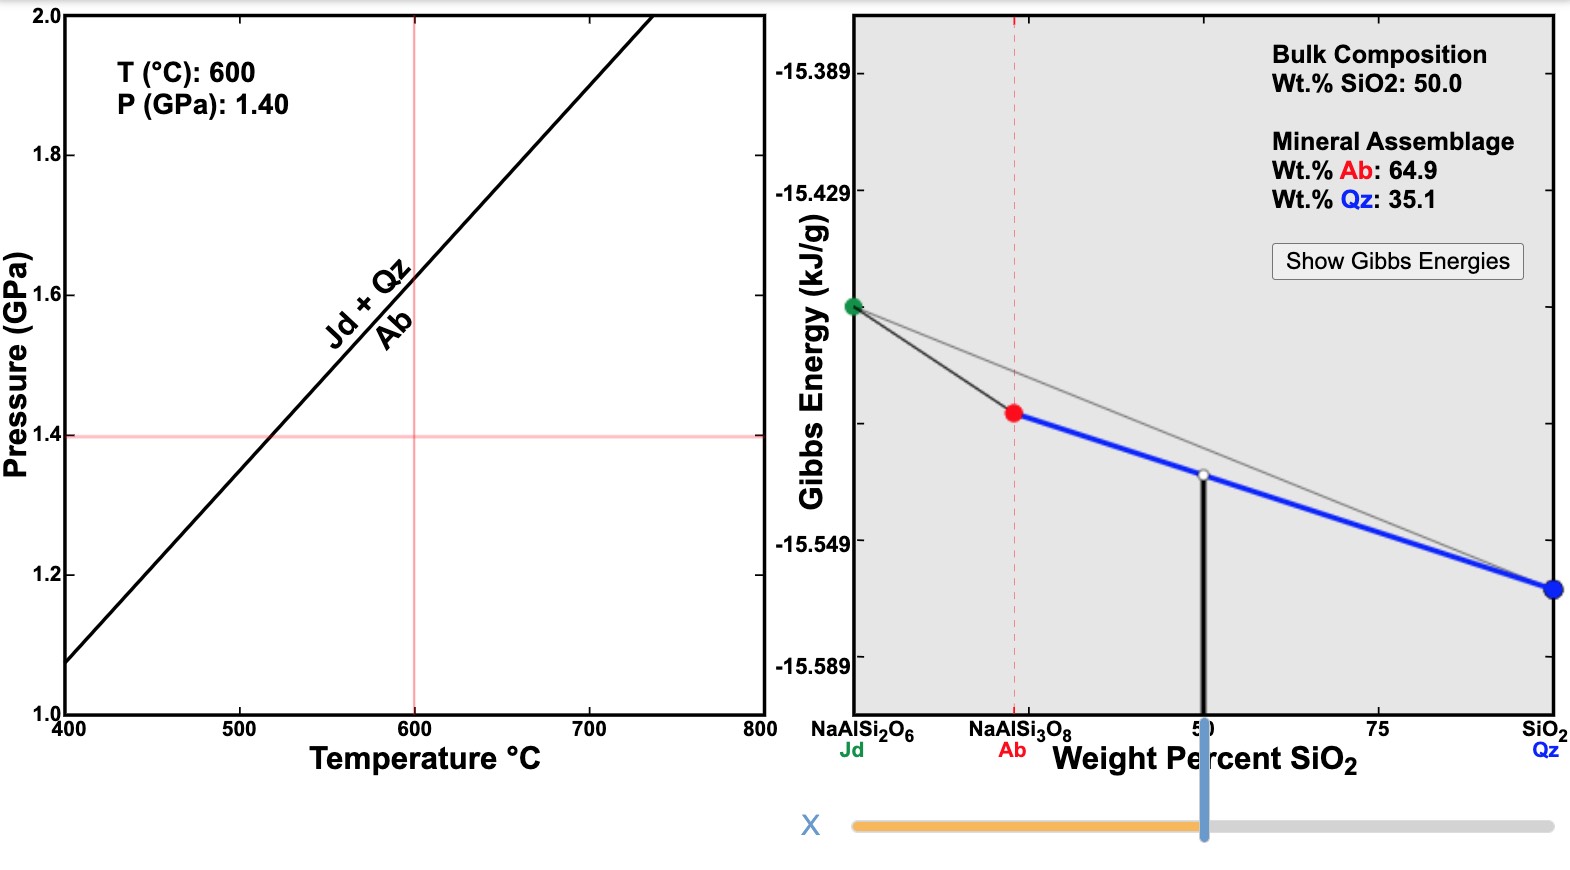
- Figure 1.06. Ab= Jd + Qz Reaction TP and GX Interactive: mouseover to see Gibbs energies change,
with T and P, button to show assemblages and slider
to change bulk composition, button to show MAD -
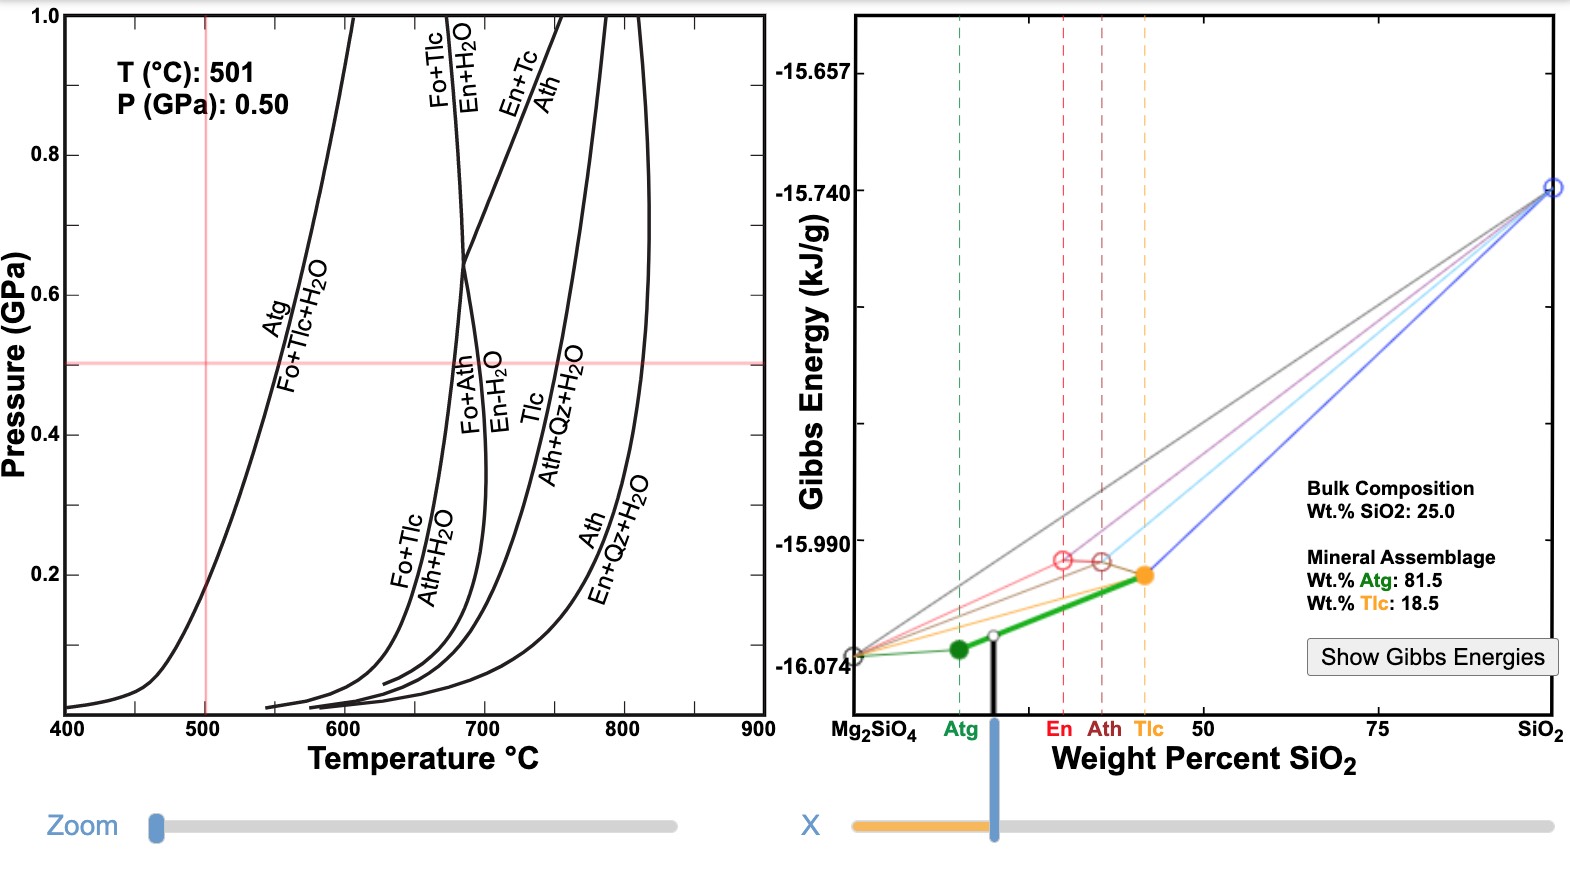
- Figure 1.07. Mg2SiO4-SiO2 Reaction TP and GX Interactive: mouseover to see Gibbs energies change,
with T and P, button to show assemblages and slider
to change bulk composition, button to show MAD -
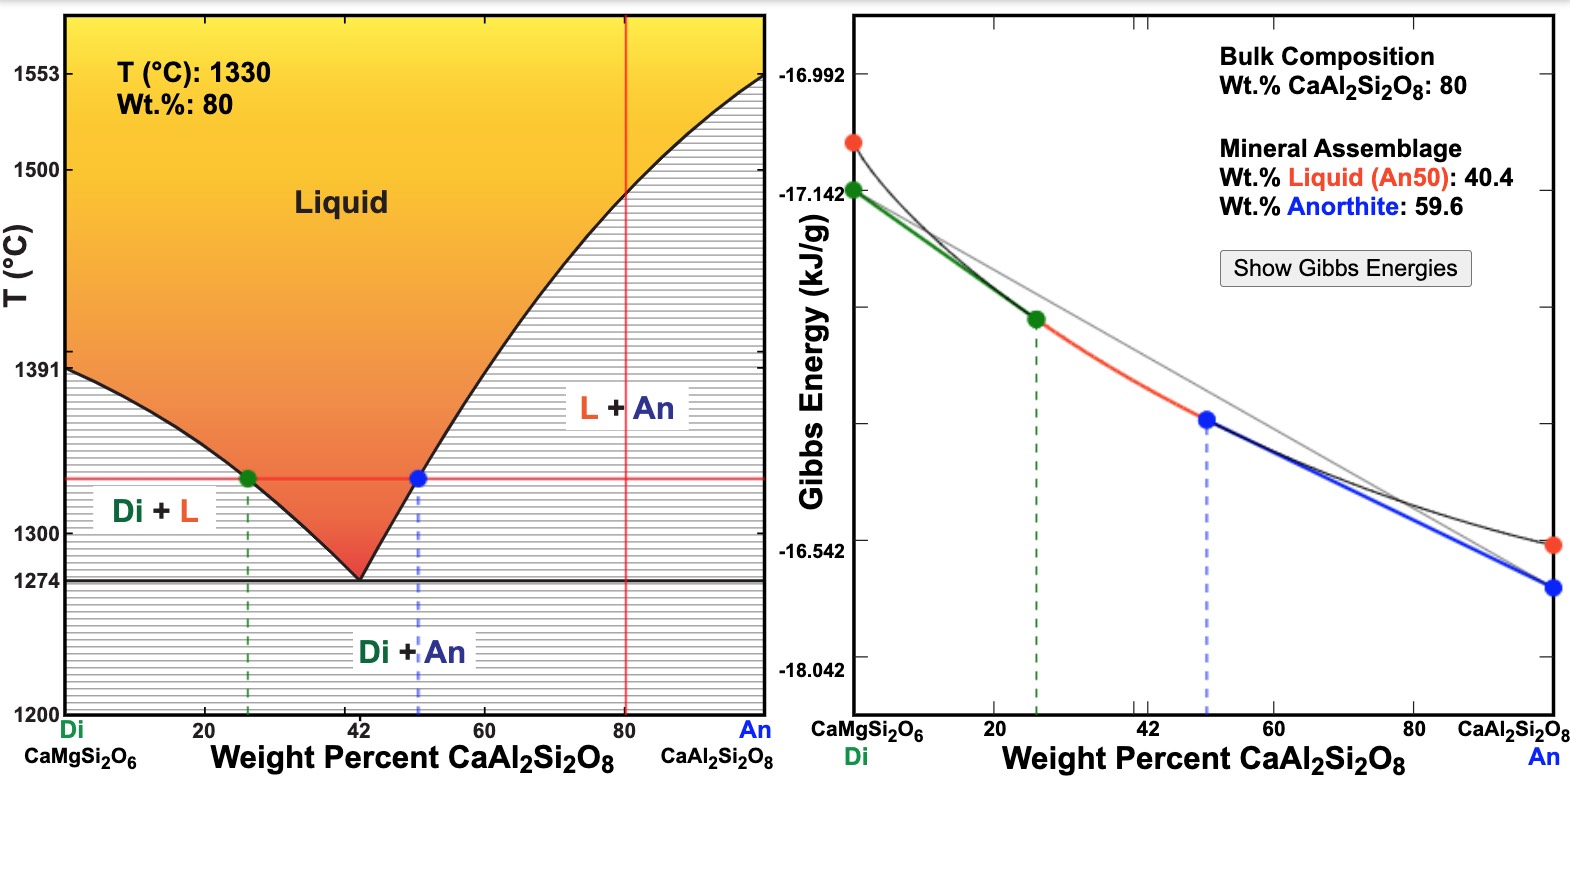
- Figure 1.09. Di-An Melting TX vs GX Interactive: mouseover to see Gibbs energies change,
with T and X, button to show assemblages and
phase compositions -
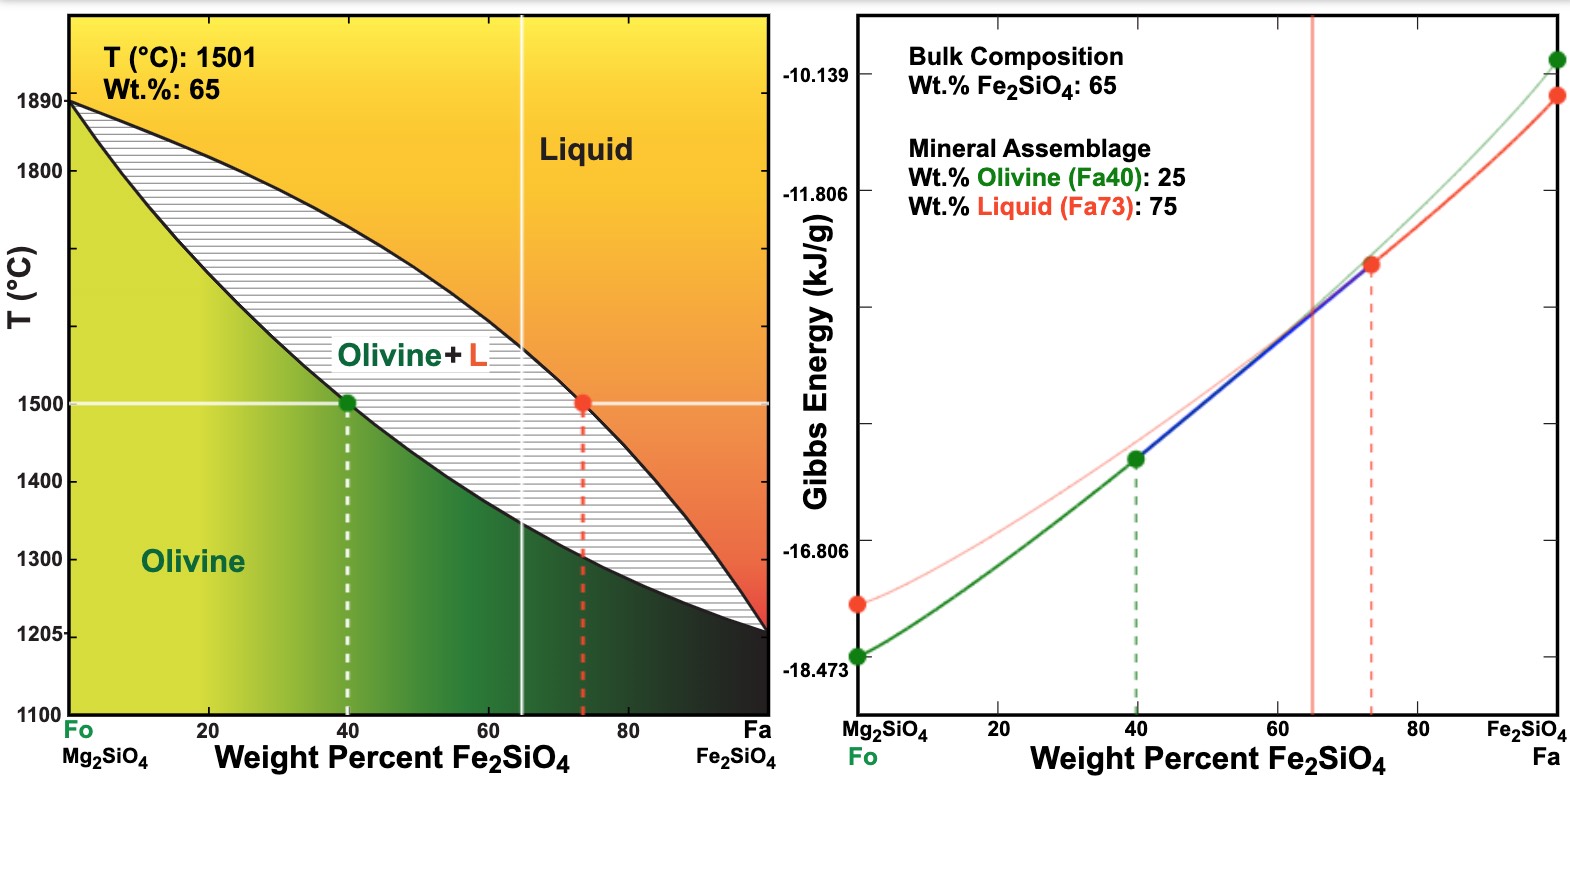
- Figure 1.10. Fo-Fa Melting TX vs GX Interactive: mouseover to see Gibbs energies change,
with T and X, button to show assemblages and
phase compositions