See what the Spatial Analysis Lab (SAL) has been up to in the great month of May:
1. Student Support
2. Faculty Support
3. Campus Connections
4. Outreach
1. Student Support
Senior week workshops (5/12 – 5/15):
In the week after finals and leading up to graduation, commonly called Senior Week, we hosted a series of informal lab workshops to teach GIS skills. The idea behind these workshops was to provide an open lab space that was accommodating of both experienced and inexperienced GIS users. This way new users could work on an introductory lab with support from SAL staff, and seasoned users could work one-on-one with staff to further develop specific skills or learn new ones!
We held the workshops over the course of four afternoons and attracted 12 attendees. The lab assignment for the first day was our introduction to GIS lab on Siting a Health Clinic in Northampton, this lab was very popular throughout the week. The second and third labs worked with Smith Alumnae data, teaching how to symbolize the zip-code and state-level data as well as how to create those layers with attribute joins and spatial joins. The final lab introduced raster data in the form of a Valley DEM (5m). The lab challenged users to explore the bikeability of the five-college towns and answer a series of critical questions around the topic.
The week was an overall success, bringing brand new users to the SAL including faculty curious about integrating GIS into their teaching and students curious about using GIS in their research.
Botanic Garden Summer Intern Training:
To kick off summer in the SAL we welcomed this year’s Botanic Gardens summer interns for a week long GIS training. The three interns gained a foundation in map making and data collection that they can apply to their individual summer-long projects. These projects include:
- Continuing our mapping invasive species project to help mitigate the spread of invasives along the Mill River, while also helping to develop a new plan and procedure for this process.
- Helping the Botanic Gardens establish Smith as a Tree Campus USA by contributing to the tree inventory mapping project and measuring tree heights across campus.
- Developing baseline data for 2015 as year-zero for a waterfront stewardship project
Our week-long GIS “bootcamp” taught a variety of basic skills and spatial literacy concepts. These included:
- Basic navigation in ArcMap
- Basic data acquisition practices
- Creating data with GPS units
- Contextualizing GPS data in the map with data from external source (MassGIS)
- Basics of data organization
- Basics of troubleshooting ArcGIS
- Using all of the new skills to begin putting together a map with limited instruction
Now that the BG interns’ training in the SAL is over they’ve gone outside to support garden work across campus and begin their individual research projects. We expect to work with each of them throughout the summer on their various GIS-related projects.
2. Faculty support
Map of Dakar, Senegal:
We are working with an Anthropology professor to develop a map of Dakar, Senegal for her upcoming publication. The black-and-white map includes select neighborhoods, roadways, and points of interest across the city to geographically contextualize the content for readers.
3. Campus Connections:
Summer travel map: Where are Smithies this Summer?
In the final weeks of the school year we put together an online map for students to submit their summer plans in order to visualize the impressive spatial distribution of summer travel, research, and work. The responses we received represent what we expected to see – students traveling far to participate in really interesting work with really interesting people! However, we weren’t able to reach the number of students we were hoping to, so the resulting map looks more like a sampling than a solid surveying.
Additionally, it is hard to create and maintain such a map without critiquing the platform a little. Esri has provided the means for crowdsourcing such information – see their women in GIS map for a good example (made from this webmap). While the platform is simple and sleek, it still leaves a lot to be desired in terms of user-friendliness and ease of upkeep. For example, there is no way for the administrator to delete points without letting the public also delete points. This issue is further complicated by the point-placing process in which any mouse click after you’ve selected the feature will add a point to the map. As a result, many users of our map accidentally created multiple points before landing on their final accurate point. Ideally users would understand that they can edit the points and move them after creation, but this is also hard to do! As a result, the map got a little messy, and the upkeep on our end became high.
The platform is still young, and doesn’t seem ready to crowdsource data very effectively. Hopefully the kinks will be worked out soon and a smoother system will be put in place for us to collect student summer plans in 2016!
4. Outreach
Northeast Arc User Group Spring 2015 Conference:
Jon and Victoria from the SAL attended the annual Spring NEARC Conference held at UMass Amherst (see the full schedule here). The conference brought together GIS professionals from all different industries to attend various panels, workshops, and poster sessions. It should be noted that the Keynote, Catherine D’Ignazio from Emerson College, was phenomenal, presenting a lecture titled “Making and Unmaking Maps”, described as:
Through projects and examples, this talk makes the case that “data visualization” is not the only or possibly the preferred method for staging public conversations about complex issues. Rather, we may need to look to methods such as storytelling, unmaking maps, contesting data, building community, and making things talk that are more embodied, messy, and fluid.
Jon presented twice during the day, first to a full room with a lecture titled UAVs in Academia: Challenges and Opportunities, and later on a panel on GIS in Higher Education with a number of fellow GIS supporters at local colleges and universities.
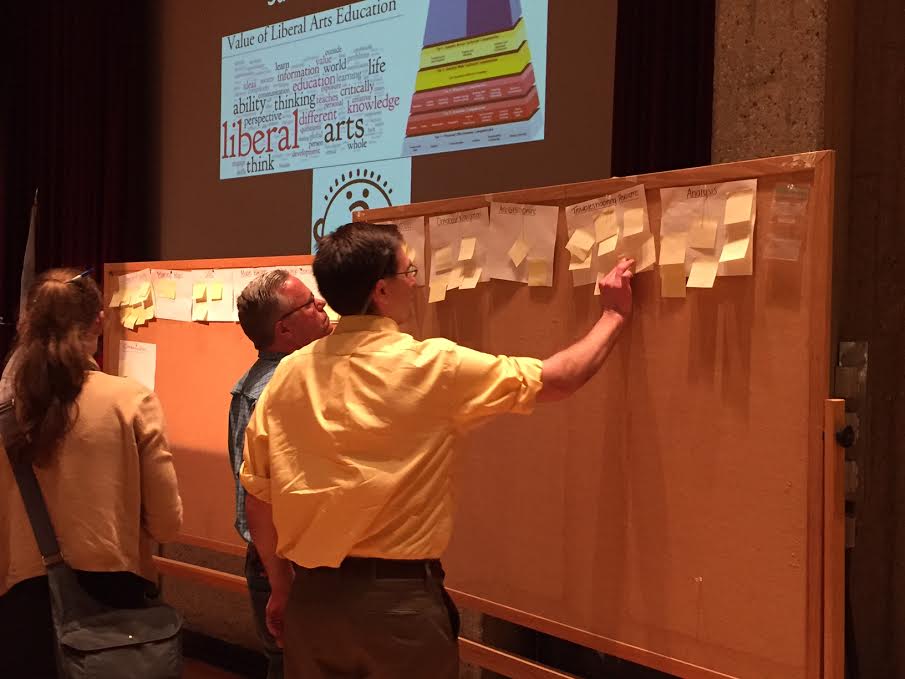
Audience input on key GIS skills in higher education, photo: Cary Chadwick
Victoria remarks that her favorite part of the conference was a conversation she had with a graduate student named Erika about her poster on environmental and undetermined causes of death during border crossings in Arizona. She compiled data from sources including local NGOs that support immigrants by providing water and food along the journey into the States, as well as from US Border Patrol. Erika mapped the data to look at spatial correlations between the reported deaths and proximity to border towns as well as the Tohono O’odham Indian Reservation. Most interesting were the various causes of death that she investigated with her maps. Victoria was surprised to hear that hypothermia is an even more common cause of death than heat exhaustion, wow! When asked what his favorite part of the conference was Jon said the post-conference networking event at the campus pub.