Two weeks ago, the SAL team headed to Popham Beach State Park, Maine, with Prof. Bob Newton’s Geomorphology class. Bob has taken his Geomorphology class there for several years to assess erosion at the beach. A major erosion event in the mid 2000s threatened the park’s facilities and nearby homes, which were previously shielded from the waves by 200+ meters of beach. Over the past several years, the beach has rebounded naturally, now reaching nearly as far as it did twenty years ago. Bob’s classes have measured how much sand is deposited on the beach every year as a first step towards understanding why the erosion/deposition process happened and whether it will happen again.
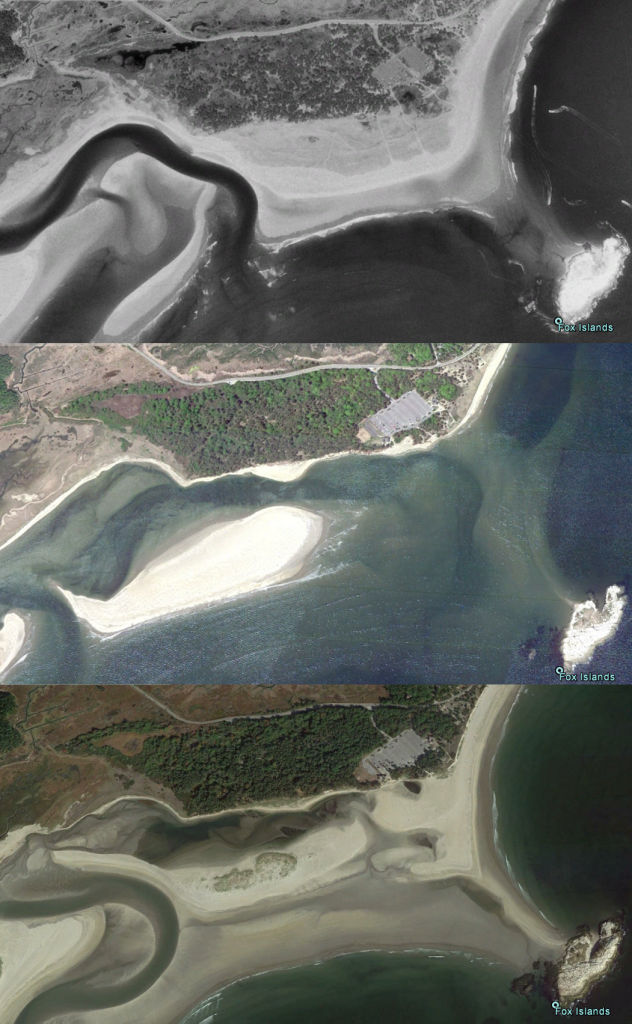
Popham beach in 1997 (top) before the erosion event, in 2010 (middle) after the erosion event, and in 2014 (bottom) in recovery.
Bob’s classes use a tried and true method to take these measurements. First, they locate the several benchmarks, marked locations with known coordinates, that Bob and his colleagues have set up. Bob’s students use these benchmarks to measure the exact location of a total station, a surveying instrument. Then, the students use the total station to measure the elevation of the beach along several transects which Bob defined at the outset of this study. Comparing the elevation changes along these transects from one year to the next allows Bob’s students to estimate how much sand has been deposited per meter of coastline.
This year, however, we also brought our drones. While an endangered bird species prevented us from flying at Popham Beach, we did manage to fly several missions at neighboring Seawall Beach (with permission). On each ~5 minute flight, the drone took a series of still images along its snake-like flight plan. Using the software Pix4D, we’re able to stitch all of these photos together into a cohesive, geo-located orthophoto. This allows Bob and his students to compare the photos with older aerial imagery to track the beach’s restoration. Furthermore, using a technique called stereophotogrammetry, we’re able to measure the elevation of each 3cm x 3cm pixel in the study area. This is revolutionary for Bob’s class and similar projects in coastal geology. Bob and his class take approximately three hours to measure along just four lines with the traditional surveying method. They then have to assume that these one-dimensional transects are representative of the entire, two-dimensional surface of the beach. With drones, in just five minutes we can collect an elevation every 3cm across an area of ~ 35,000 sq. meters. With these kind of data, we no longer have to rely an estimate of how much sand is deposited per meter of coastline. Rather, we can calculate the exact amount of sand on the beach (and, once we have multiple years of drone data, the total volume of sand deposited on the beach from one year to the next).
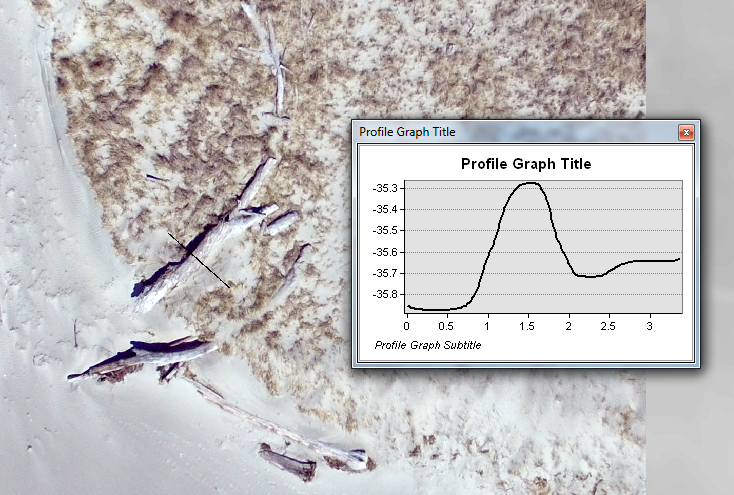
In the high-resolution orthophotos that we created, it’s easy to pick out even individual clumps of grass. The elevation data is precise enough to identify a log on the ground, as seen in the elevation profile graph on the right.
Of course, the drones present their own challenges and require a substantial amount of work beyond the five minutes that they’re in the air. In post-processing, we’re able to locate the imagery and elevation data in space thanks to a GPS unit on the drone. However, this unit is much less accurate than the total station, meaning it can be difficult to make the imagery appear exactly where it was taken on the ground. To correct for this, the ideal procedure is to measure a set of control points with the total station in the flight area. This allows the Pix4D software to correct for GPS errors in post-processing. Unfortunately, we weren’t able to do this due to time constraints. Another drawback with the drone is the possibility for drone error. This can be caused by people or things moving during the flight, sudden elevation changes, or deviations from the flight plan due to wind. It’s nearly impossible to catch or correct any of these errors in the field, meaning if you spot them in post-processing, you either have to go back into the field to refly the mission or you’re SOL.
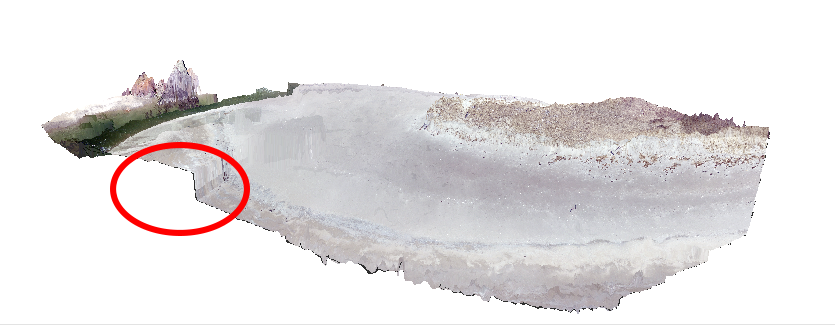
This 3D model of a flight area on Seawall Beach reveals a steep change in elevation on what should be a flat beach, likely caused by an aberration in the drone’s flight plan.
For now, while we work on getting past these challenges (and the many regulatory challenges, which is a topic for an entirely different blog post), our drones are still in beta and are not a replacement for older techniques like surveying. However, it’s pretty easy to see that our drones have the potential to be much more powerful than traditional methods. Beyond geology, this is true for archaeology, agriculture, ecology, and shipping, among many others. We’re excited to be on the cutting edge of drone technology and hope that our students will take away an understanding of the promise of drones when used responsibly. If you’re interested in learning more, please contact one of us!
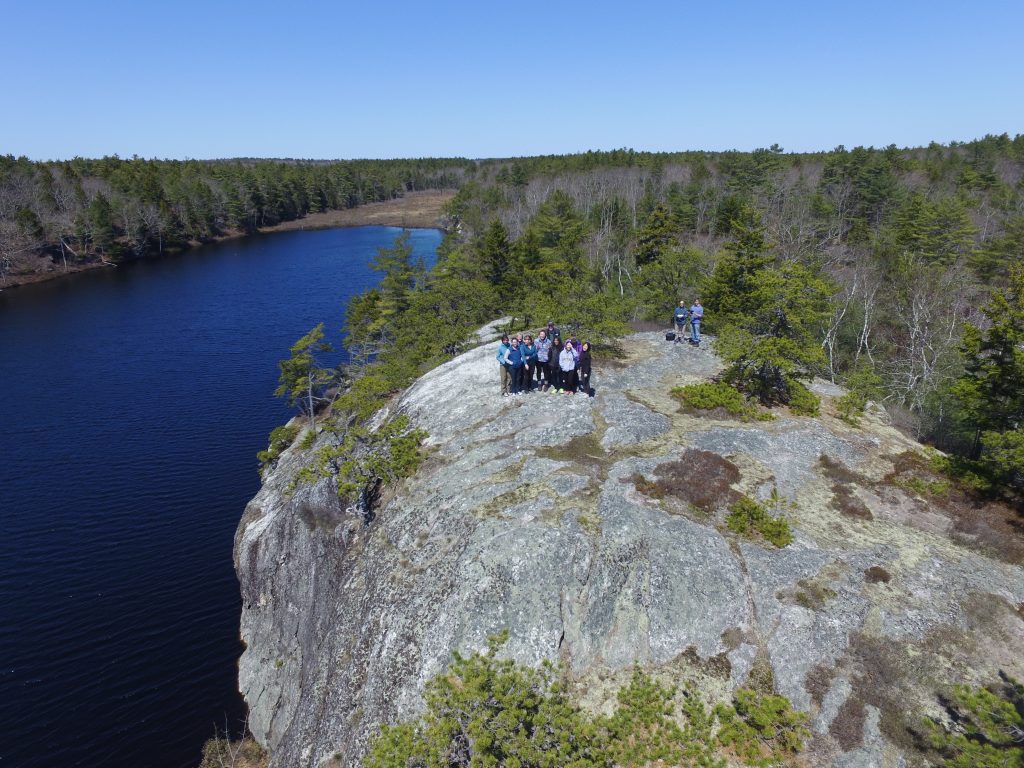
A dronie of Bob, his students, and the drone team at the Bates College Shortridge Lodge