Spatial Analysis Lab work in March 2015
1. Class Support
2. Campus Connections
3. Outreach
1. Class Support
- ENV201/202:
In the first two weeks of March we hosted Professor Camille Washington-Ottombre’s class Environmental Integration II: Collecting and Analyzing Information (ENV201/202) for a series of class sessions. The six class sessions were split into two labs, one per week. The first lab titled Impervious Surfaces and Utility Fee for Stormwater and Flood Control on Smith Campus focused on mapping surface permeability across campus. The class looked at a polygon layer of campus land-use that included types like buildings, parking, lawns, other green space, paths, and river. These land-use types were then assigned permeability values — pervious (grass, dirt), impervious (sidewalks, roofs), or null (the river) then rasterized to be used in raster calculations with other campus data. Students calculated the total amount of pervious and impervious surface to use in an equation to determine the amount of taxes Smith will pay the city for the permeability of its land.
In the second lab students worked with our campus Digital Elevation Model (5m accuracy) to consider water movement in relation to elevation across campus. The DEM was used to calculate slope, which students reclassified to identify steep, gradual, and flat parts of campus. Using the raster calculator students combined the reclassified slope raster with the permeability raster to identify parts of campus that were steep/impervious where water runoff might build momentum as well as flat/impervious areas where standing water might form. Students were tasked to collect GPS locations of standing water around campus. The collected data were compiled into a point layer in which puddles were classified as small, medium, or large based on dimensions decided on by the class.
The final assignment was for students to select one feature on campus to change to improve drainage on campus. Examples of this include:- Reducing amount of impervious pavement near JMG
- Creating a rain garden at the bottom of the hill before College Lane
- Altering the gradient of certain paths to improve drainage and reduce standing water
- Spring Workshops:
In March we completed our Spring workshop set with our final four workshops:- Geocoding Address Data — we geocoded the addresses of donors for the 2011 Narkewicz and Bardsley mayoral campaigns
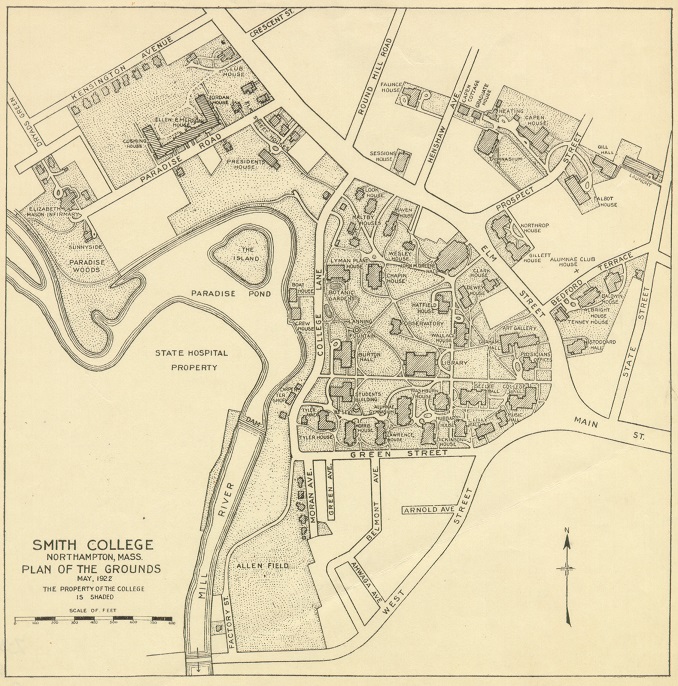
- Georeferencing Historic Maps — we georeferenced historic maps of Smith College from our archives reaching back to 1910
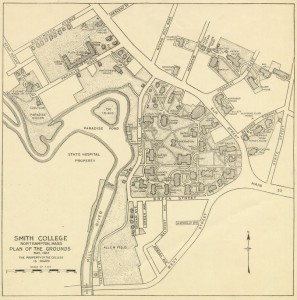
Smith College Map 1922
- Telling Spatial Narratives I — we created webmaps using food access geographic data from Springfield, MA
- Telling Spatial Narratives II — we built upon the first workshop to transform the webmap into a storymap
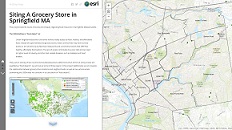
Click to view storymap
We had 43 attendees to these 4 workshops, bringing our Spring workshop attendance total to 121. The guides and worksheets from each workshop are compiled here. If you are interested in working on the workshops individually they can be downloaded from that link, for additional support visit the SAL during our lab hours.
- SOC232:
The Spatial Analysis Lab hosted a session of Professor Leslie King’s SOC232 class, World Population, in which we continued the class’s study of global infectious diseases by mapping Ebola in West Africa. The hour and half lab comprised of two main parts. First we learned to map for first aid responders in West Africa using the OpenStreetMap editing platform to digitize features based on aerial photography. We contributed to a project run by the Humantiarian OpenStreetMap Team (HOT) to digitize infrastructure in Bamako — the capital city of Mali. This process helps responders navigate previously unmapped road networks and locate important landmarks like river-crossings and fields for landing helicopters. For more information check out our post about previous Ebola mapping workshops hosted in the SAL.
The second part of the class looked at available Ebola data produced in the past year by country governments in West Africa as well as the World Health Organization (WHO). We discussed issues of data inconsistencies, data management and formatting for the GIS, and cartographic decision-making — How do we accurately visualize these data? what story can a map tell? We used a sample timeslider visualization of monthly reported confirmed cases of Ebola in Liberia, Sierra Leone, and Guinea from Sept ’14 – March ’15.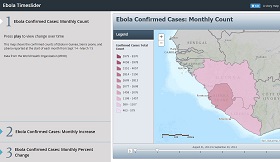
Click to view Ebola Timeslider Storymap
2. Campus Connections
- Invasive Species Mitigation:
We hosted a meeting on March 11th to bring together the Smith Botanic Gardens staff and student interns with the New England Wild Flower Society (NEWFS) to discuss the crafting of a new mitigation plan for invasives on campus. In previous years student interns have used GPS units to map the location of invasive species near Paradise Pond, but because methods for data collection and processing have varied between years the amount of analysis available to Smith and the NEWFS has been limited. Our Botanic Gardens are looking to collaborate with the NEWFS to solidify a plan for future documentation of invasive species to allow us to better map and analyze development. Click here to read more about Smith senior Jessie Blum’s work in on this project and view her maps.
3. Outreach
- Drones Event:
Spatial Analysis Lab Director, Jon Caris, represented the AIRLab in his presentation as part of the Commercial Drones in Our Backyard event on March 4th in JMG. Jon discussed innovative uses of drones in research today, as well as how Smith hopes to use drones for in research on campus. Paul Voss,Professor of Engineering, discussed the history of FAA and what future legislation might mean for academic research. Bob Newton,Professor of Geosciences, also contributed to the conversation talking more about Smith need for drones in research in the Sciences including aerial photography of eroding beach lines in Maine, and crafting a mitigation plan for sediment build up in Paradise Pond. To complement the presentations the event included a drone display (or drone petting zoo) as well as a live flight demonstration. The event was attended by a number of Smith students, faculty, and staff, while also having a nice turnout of local residents and the Five College community. For more information on the topic listen to this interview from local radio station WHMP with Jon Caris and Paul Voss (minutes 20:40 – 32:10), or watch a recent WGBY episode of ConnectingPoint.
- Valley Gives Day Mapping:
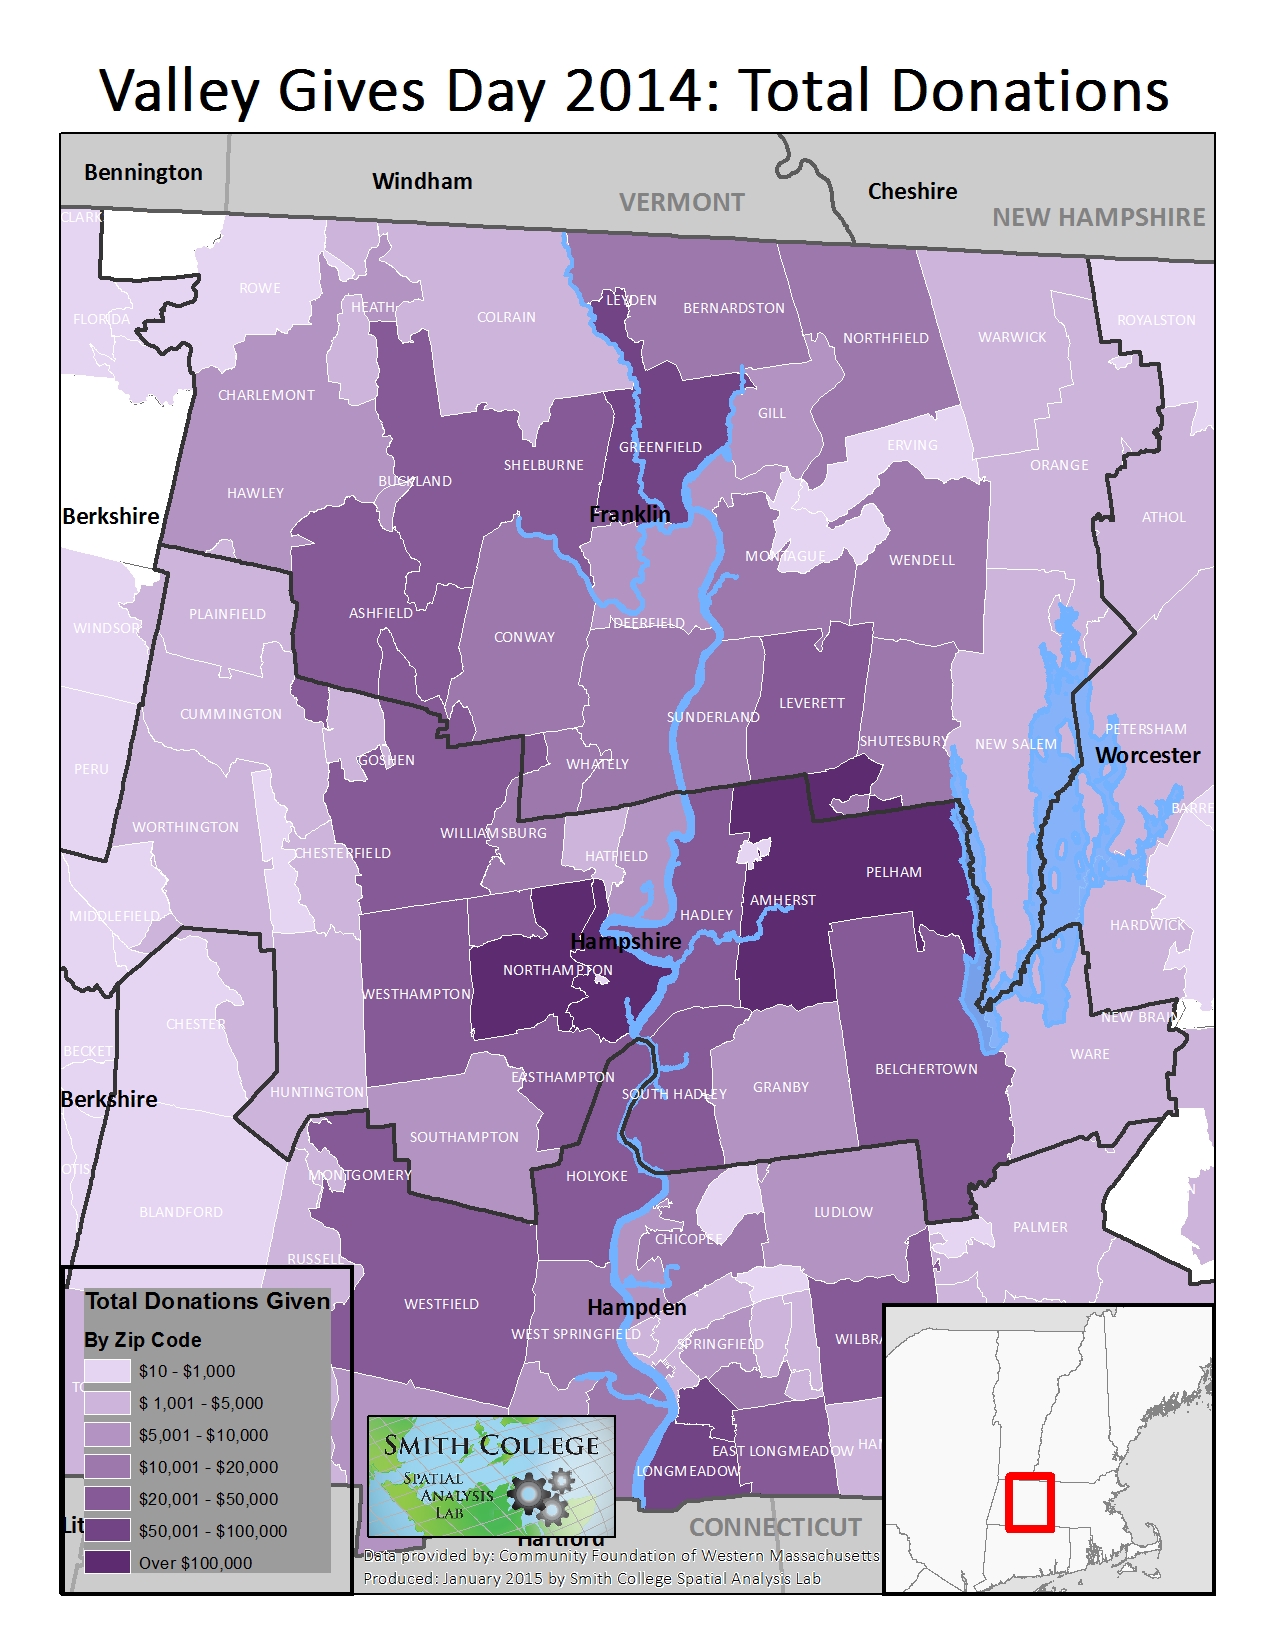
Our post-bac, Victoria Beckley, finalized a set of maps for the Community Organization of Western Massachusetts, the organization that hosts Valley Gives Day. The maps show data compiled for Valley Gives Day 2014 last December:- Amount donated, summarized at the zip-code level, in Western Mass
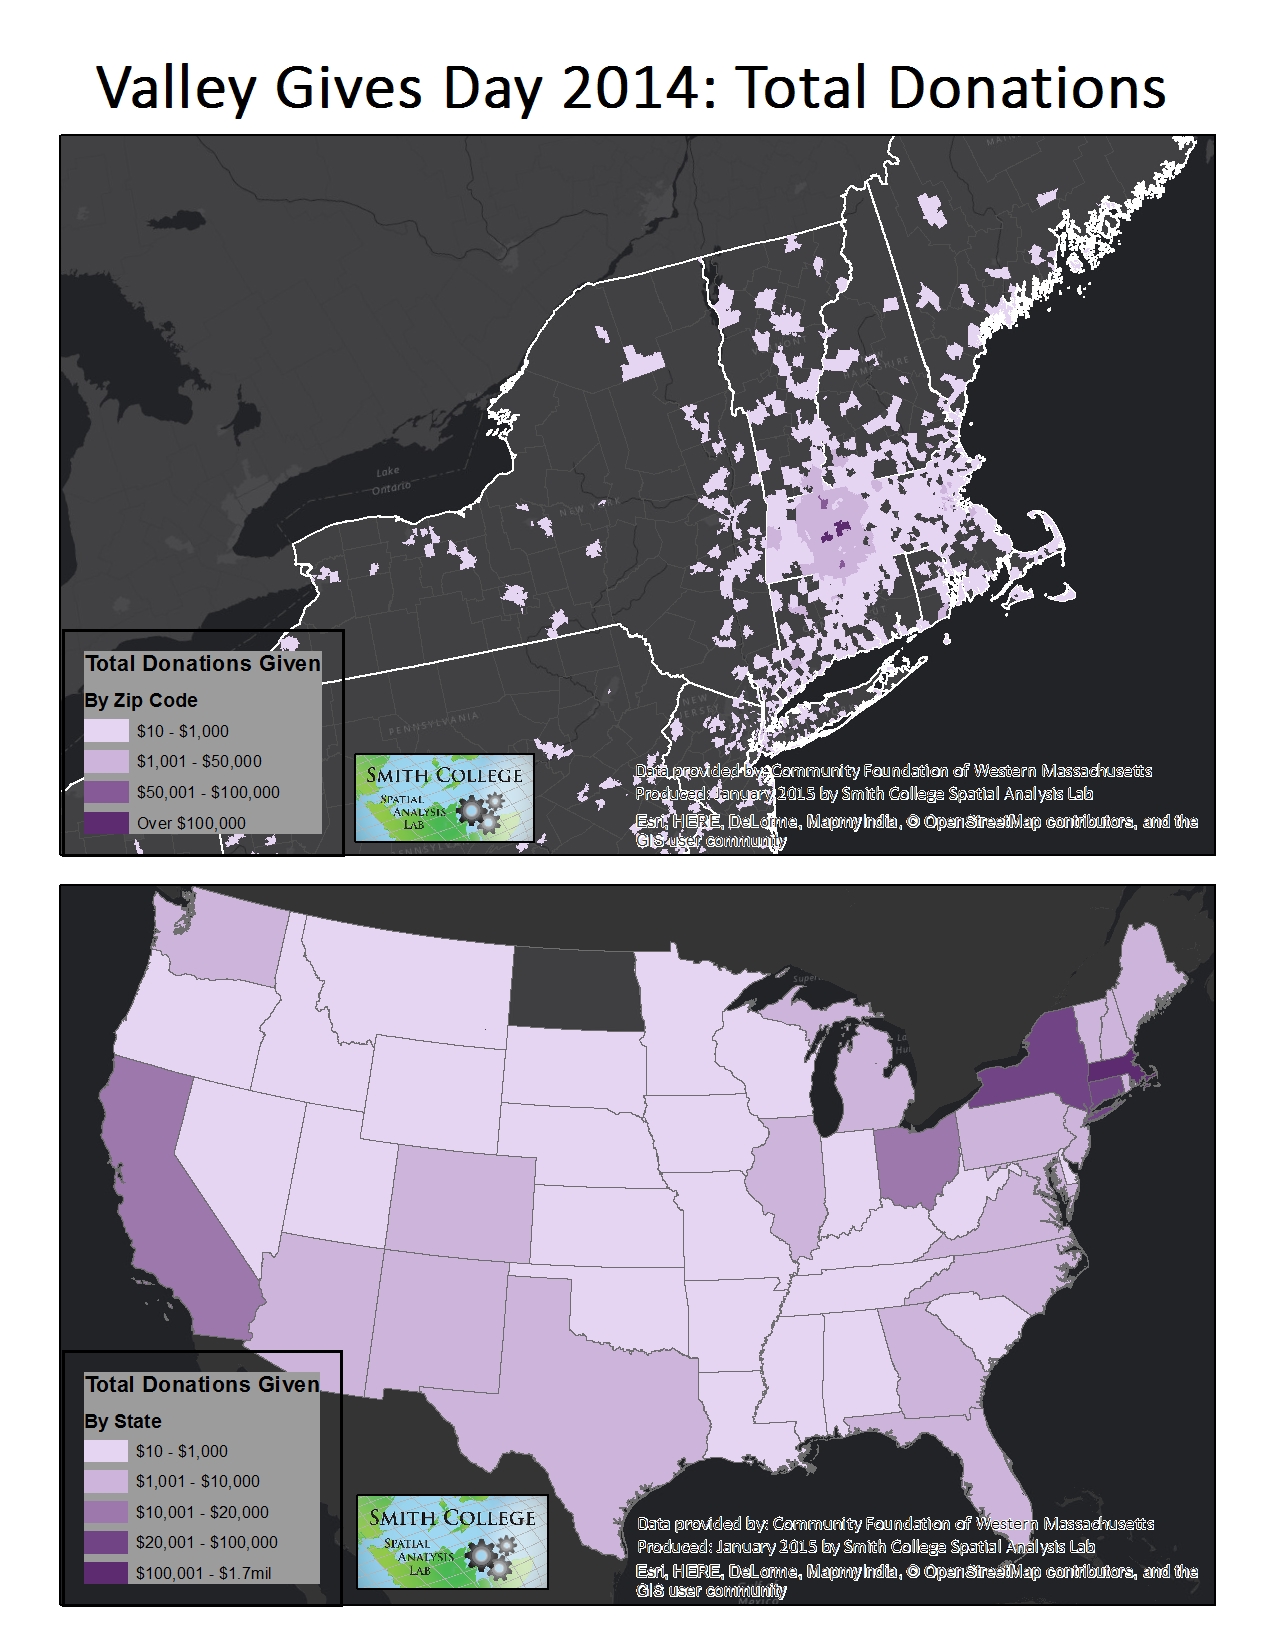
- Amount donated, summarized at the zip-code level, in New England
- Amount donated, summarized at the state-level, in the US
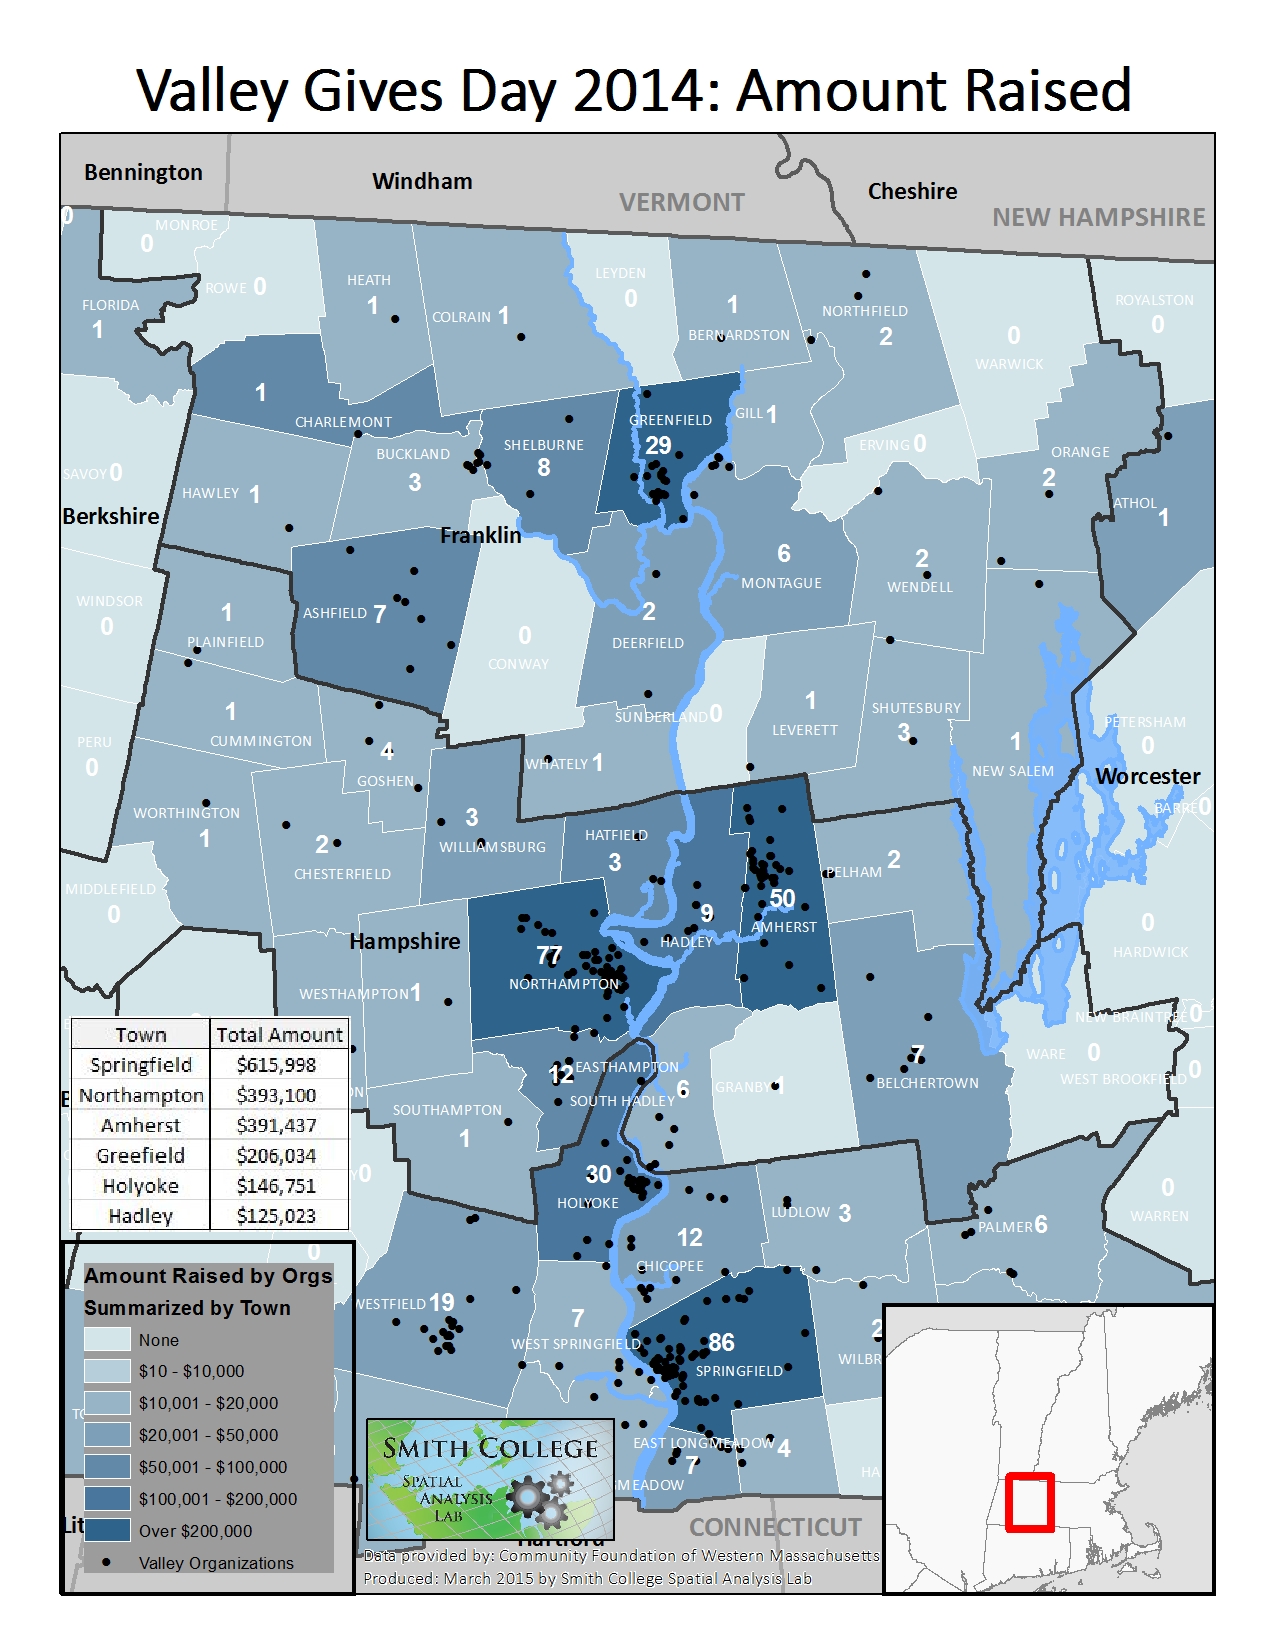
- Amount raised by organization, summarized at the town-level, in Western Mass — also including counts of organizations located in each town and a table displaying the amount raised by the top 6 towns