Answer Revealed:
As many of you successfully guessed — our winter mystery map, themed: Annual Valley Event, was mapping…
Valley Gives Day 2014!
Location Donations Given Final
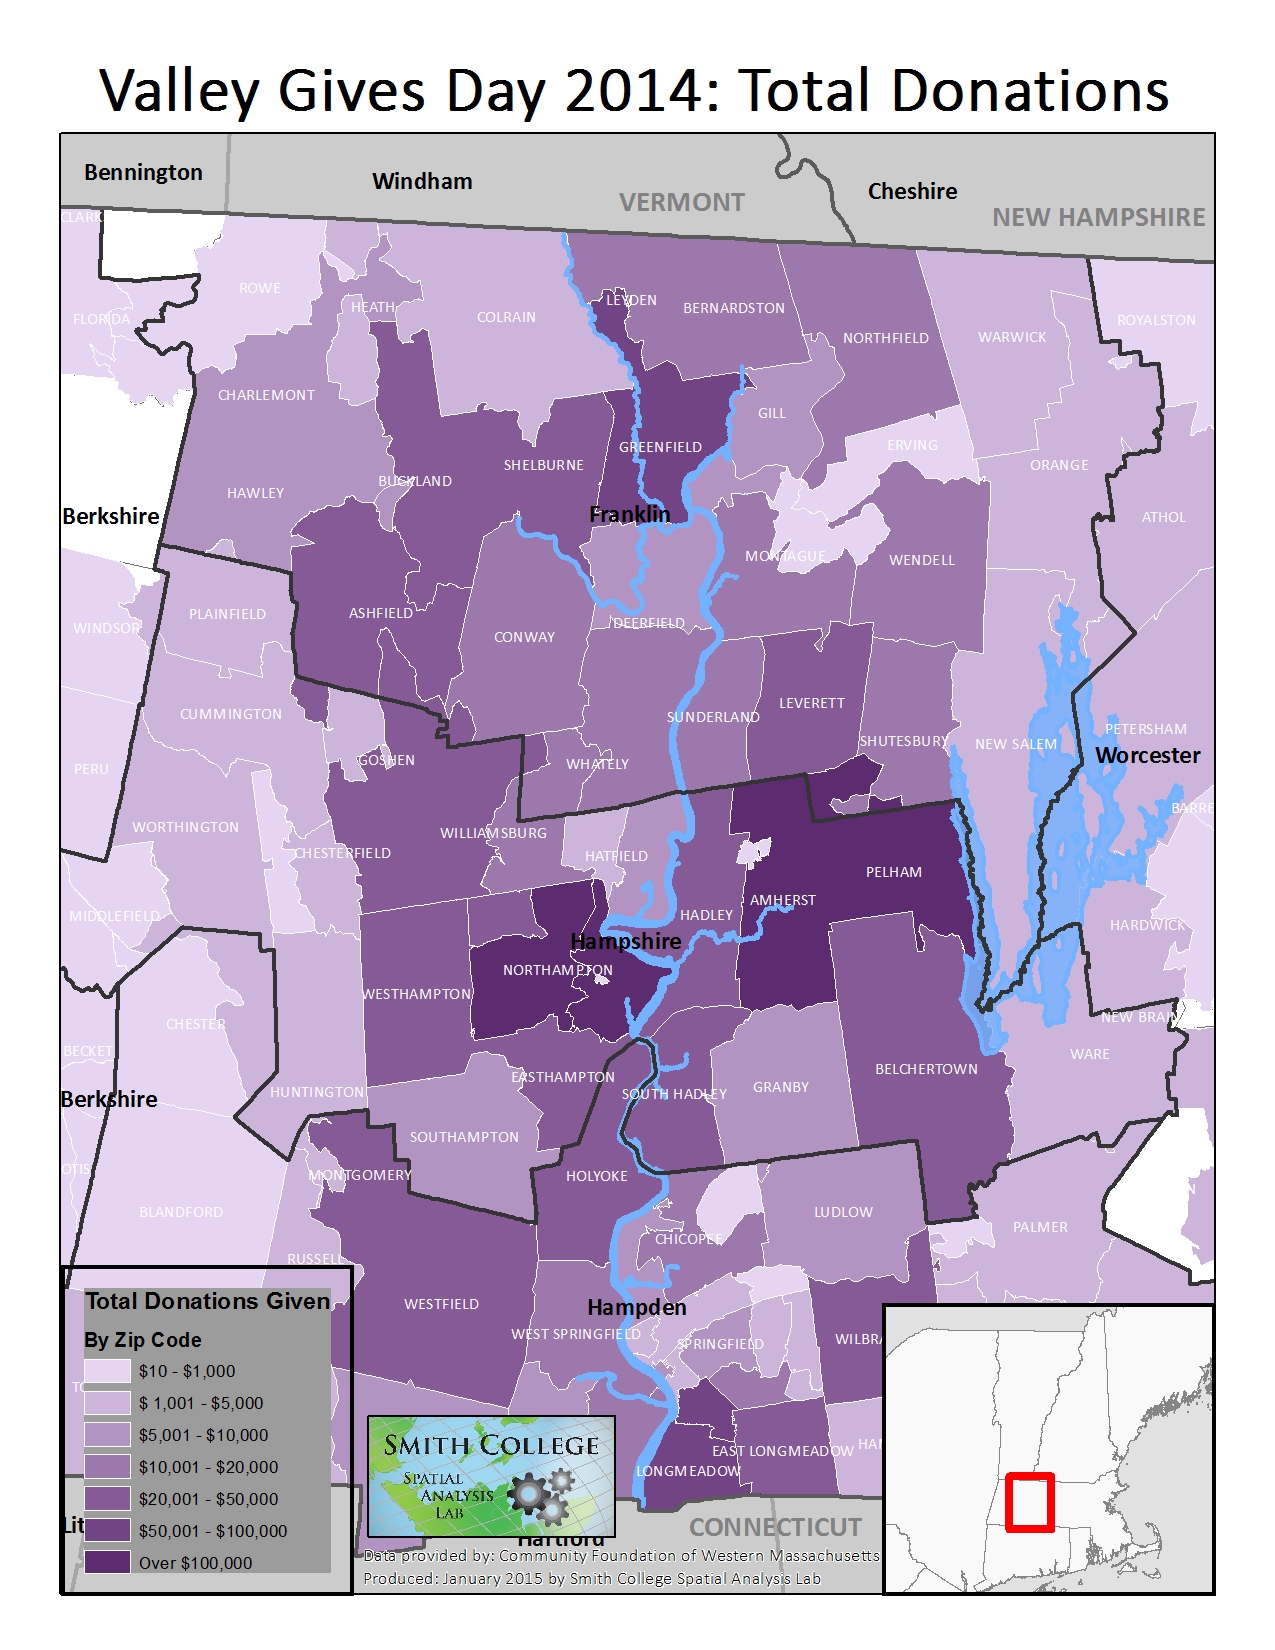
Making the Map
The first map produced was the one used as the winter mystery map. The spreadsheet containing data about the donors’ locations included a zip-code field, which was the easiest piece of data to clean-up and join with an existing layer in the GIS. The zip-codes were reduced to a five-digit number, the field was saved as an integer, and the spreadsheet was added to ArcMap. The spreadsheet contained 28,000+ features representing each donation made throughout the day, meaning that zip-codes like 01060 (Northampton) where many donations were made, there were multiple features with the same zip. To compile these so that each feature represented a zip-code with a field indicating total amount given, the summarize tool was used to summarize the amount donated by zip-code. This resulted in a table with 1,756 unique zip-code features.
Next, the national zip-code layer was added to the map and joined with the 1,700+ zip-codes in the table. The data was symbolized at the local level using the breaks shown in the legend in the map above. The most money given by any zip-code was from Amherst, 01002, which gave a total of $211,766.
For the local map I focused on the Pioneer Valley. I also produced a regional map and a national map because turns out that donations were given from 49 of our 50 states! For a local campaign! Take a look at the regional map (still divided by zip-codes) and the national map (by state) to see the spatial distribution of donations, also to ponder about North Dakota… The national map was made with a spatial join between the zip-code layer and a US states layer.
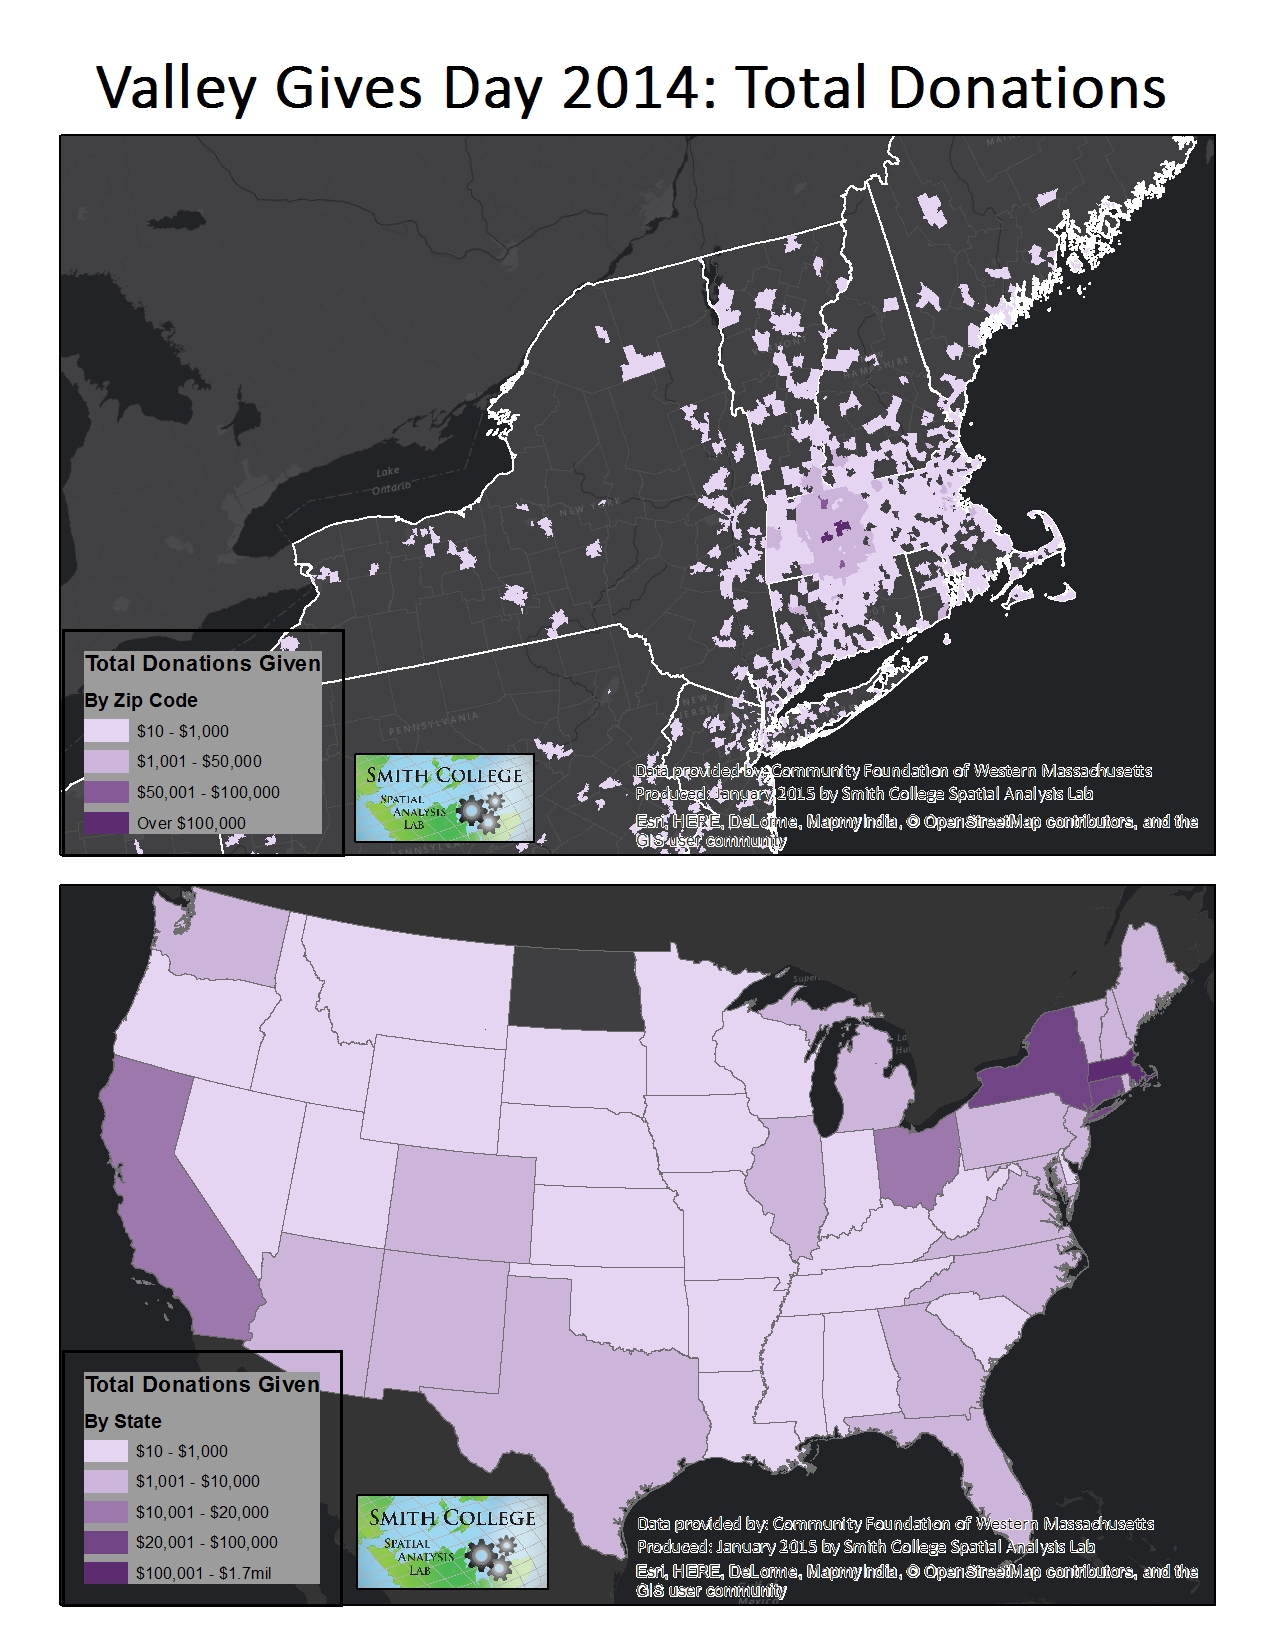
Regional and National Donations Given Final
The Winner!
And now the moment you’ve all been waiting for — who was the first to submit a correct answer to the mystery map challenge??
Jessie Blum
A senior environmental science student who has aspired to win the mystery map challenge for years, and also happens to have an affinity for map-making. She works with us in the SAL on mapping invasive plant species and is currently working with the botanic gardens on campus and the New England Wildflower Society to craft a new invasive species mitigation plan for Smith. You can read more about this here.
Here are the wise words from our winner when asked about her problem solving process:
I actually took part in Valley Gives Day 2014 (I donated to Grow Food Northampton) and when I saw the mystery map, I immediately thought back to it. I couldn’t think of any other events that would have that quantity of donations, so I went with it! Also, it is so cool that the Valley does this…it’s so cool to see how much people are willing to donate to great local causes!
Comments on the answers submitted:
70% of the submitted answers were correct, however only the first to answer correctly can win — Jessie within hours of the challenge being posted, possibly setting a record for quickest accurate response!!
Some other guesses include tax day 2014, regional census, and scholarships rewarded to local high school students — all reasonable answers.
We asked our participants to include an explanation for the spatial pattern and some of the fine responses we received included:
– Income
– College communities giving higher amounts
– Something about relationship to farmers markets
– One respondent went above and beyond citing multiple factors: zip-code socioeconomic status, population density, proximity to the participating organizations, AND proximity to local media sponsors
Thanks to all who played!! Keep your eyes peeled for the next installation of the Spatial Analysis Lab Mystery Map!
Looking for more? Visit our Mystery Map gallery to see the highlights from the challenge over the past 14 years.
Additionally visit our Mystery Map highlights and winners page to read the exciting statistics gathered and view a complete list of the winners.