The Fall Mystery Map challenged viewers to consider the regulation of space. Each of the three maps represented a unique regulation zone that participants were asked to identify based on context clues within the maps. This led viewers to through a series of questions to determine what regulation is represented by each zone: what type of building is the zone surrounding? Based on the location and number of these buildings, what could they be? What is the distance of each zone? And finally – what regulation is this zone representing?
This thought process evoked ideas about how space is regulated – is this zone designated for a certain activity or is it restricting a certain activity? Furthermore, how is this zone presented to the public – is it a “smoke-free healthy air zone” or a “no-smoking restrictive zone”? It is promoting health or limiting use?
The fall mystery map included three maps of restricted zones, and one picture to show the scale of each of the distances shown. This (slightly photo shopped) image showed each distance as measured from the Campus Center steps – 300ft, 100ft, 35ft, and 20ft. There are four distances because Map B shows a 300ft buffer around public schools and a 100ft buffer around public parks, both buffers represent the same restriction.
The idea of mapping regulatory zones arose this summer with the political debate around protests within a certain distance of abortion clinics. We found this to be a particularly interesting regulation because instead of restricting the controversial subject at hand (abortions) it protects the procedure by restricting public expression of disapproval around the location.
We began to think about regulations as restricting one’s activity in order to enable a different activity within an area. Therefore spurring the question – does this zone disable or enable?
Making of the Map
Creating these maps was technically straight-forward, however there were two challenges in the data collection/creation process: first was digging up the correct information about the specifics of the regulations, second was locating or creating the buildings (and parks) layers. Once the buildings layer was visualized on the map a spatial analysis tool called buffer was used to create the zone around each building feature. The final step was adding the aesthetic touches: setting transparencies to reveal multiple layers, changing color schemes, and adding titles, north arrows, and scale bars.
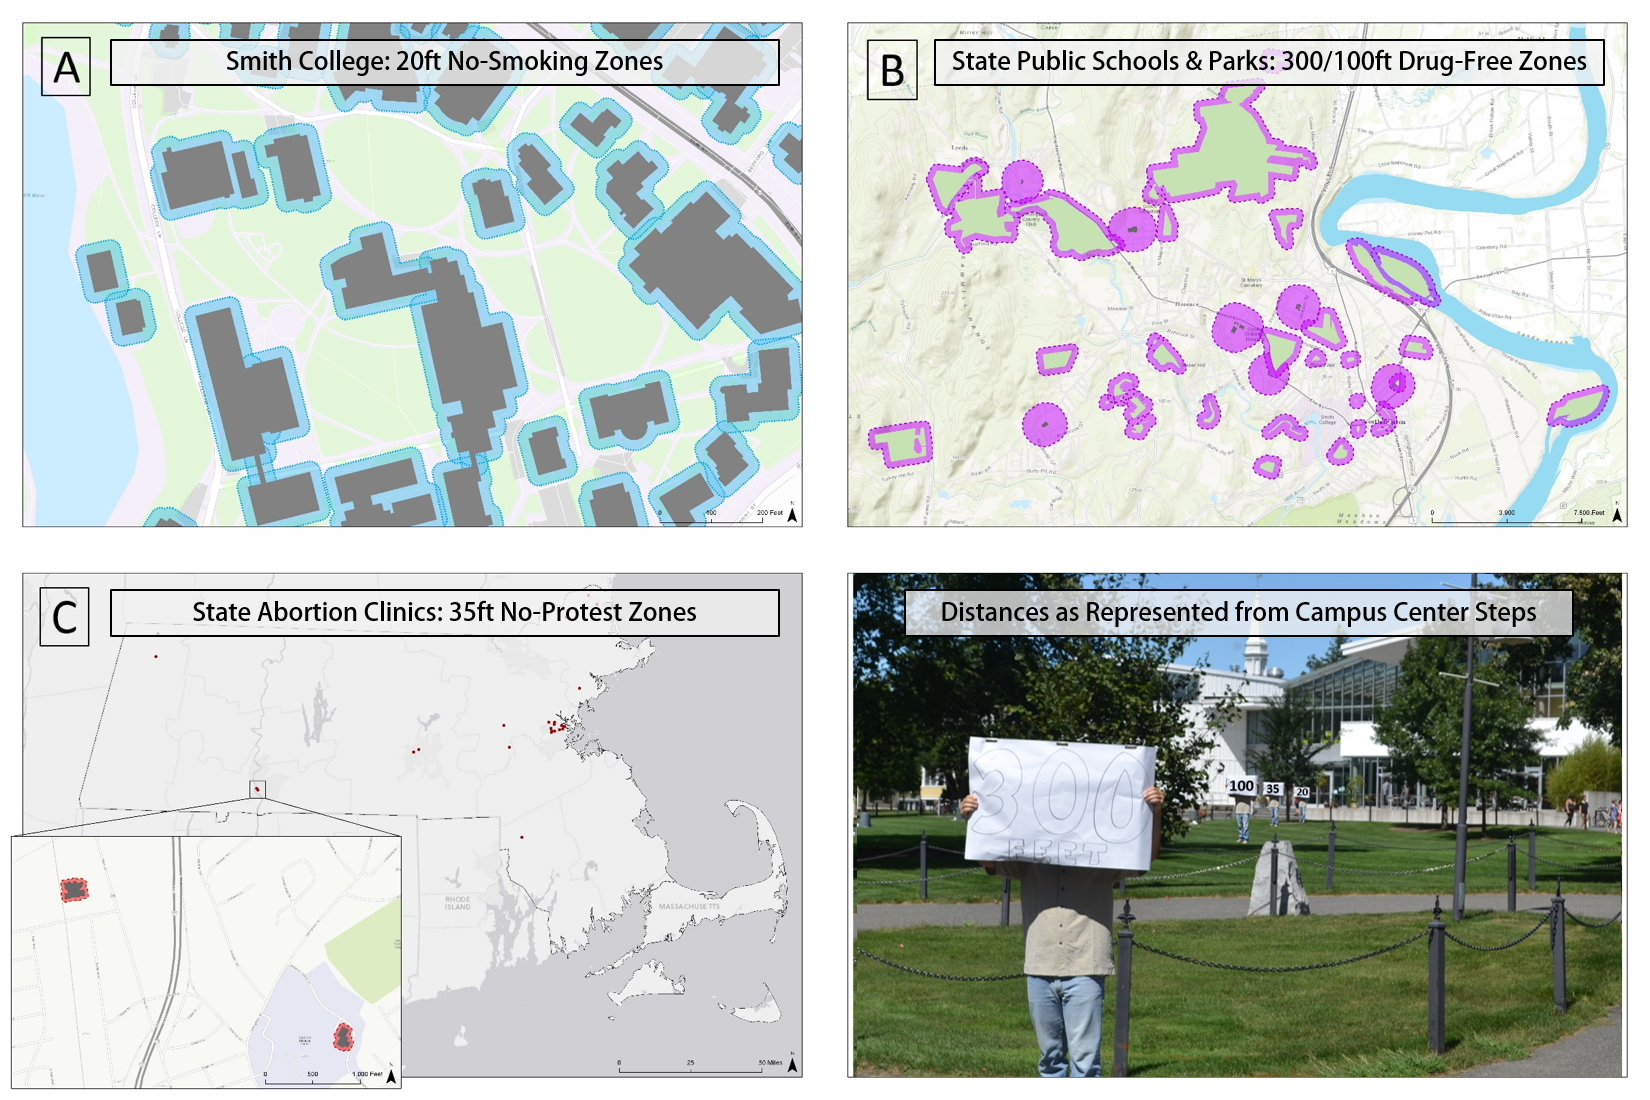
Map A: Smith College No-Smoking Zone
Smith prohibits smoking within 20 feet of any academic, residential, or administrative building. The campus building layer was found in the Spatial Analysis Lab database where it was added to the map, configured, and buffered.
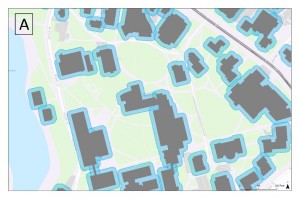
Map B: State Public Schools & Parks Drug-Free Zone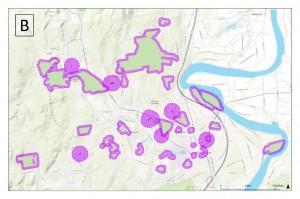
The State of Massachusetts has strict regulations within “drug-free” zones (300ft public schools, 100ft public parks) in which detected drug-activity (possession with intent, delivery, sale, manufacture) is punished with a 2-15 year prison sentence and $1,000-$10,000 in fines. Yikes!
This regulation was challenging to map because the distances have changed within the past few years. The original law, passed in
1989 to protect school children from exposure to drug activity, set the “drug-free” zone as a distance of 1,000 feet around public schools. The size of this distance quickly became
controversial. The topic was debated and researched for many years until 2012 when Governor Patrick passed a bill to reduce the size to 300 feet and limit the hours to 5am – midnight. The most comprehensive retelling of this story can be found here.
It turned out convenient that a family friend of Victoria’s (our post-bac fellow) was the primary conductor of research to reform this law – State Senator Will Brownsberger. He was helpful in clarifying the details of the past and the most current regulations.
We used Northampton as a sample location to visualize this regulation. The public schools and public parks layers were both located in our database, so using those layers proved quite simple.
Map C: State Abortio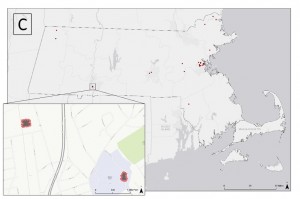 n Clinics No-Protest Zone
Information about this regulation was very accessible seeing as that it was in the news every day for about a month this summer. The law restricting protest within 35 feet of Massachusetts abortion clinics, originally enacted in 2007, was unanimously struck down by the Supreme Court as a violation of First Amendment rights in June of this year. We found this to be particularly interesting, and, as mentioned above, set out to find other regulated zones. Although this is now a “regulated zone of the past” it still made the map in an attempt to keep our topics local and relevant.
Here is a link to the official ruling and a NYTimes article reporting on the issue.
For a complete list of state abortion clinic buffer zones click here.
Although the information about the topic was easy to access, locating a map-able layer proved more challenging. The location of the state abortion clinics is not a pre-made layer we have in our database, so this data had to be compiled in an excel spreadsheet and mapped based on addresses.
For the map we included both a visual of the entire state’s abortion clinic locations, as well as an inset map with two locations in Springfield to provide a scale for the buffer distance – also a basemap hint (Baystate Medical Center).
The Winner…!
Congratulations to Sam Masinter, Director of College Relations at Smith, for submitting the first, and only, correct set of answers!
He shared with a reporter from the Spatial Analysis Lab his reasoning behind the answers:
“The committee I’m on at Smith just went over the smoking distance rule, and it was the only thing I could think of that surrounded buildings at Smith.
For drug-free, it looked like parks and schools, and the only other thing I could think of was sex-offender residency exclusion zones, but that seemed a little dark for a mystery map.
The third one was hard, because neither building is clearly marked, even in Street View. Guessing addresses eventually got me to planned parenthood, which made it relatively clear. Though, with the recent Supreme Court decision, I’m not sure those zones are still in effect”
And Sam was correct in astutely recognizing that those zones are no longer in effect! Great feedback from our two-time Mystery Map winner, Sam Masinter.
In addition to Sam’s winning answers, we received a number of other submissions that guessed at what the buffers might represent. Some of the most creative responses were:
– Alcohol free zone
– Cell phone free zone (we can only wish!)
– No drone flyover zone…
Very interesting answers and solid efforts all around.
Congratulations again to Sam for the correct answers, and within only a few hours of the challenge being posted!
Thank you all for playing, hope to see you for the next installment of the Spatial Analysis Lab Mystery Map!