
What is a heat wave?
- A heat wave, according to The World Meteorological Organization, is a “period of more than 5 consecutive days where the daily maximum temperature exceeds the average maximum temperature by 5°C or more.”
- The frequency, duration, and intensity of heat waves have increased recently with ongoing global warming (graphs below).
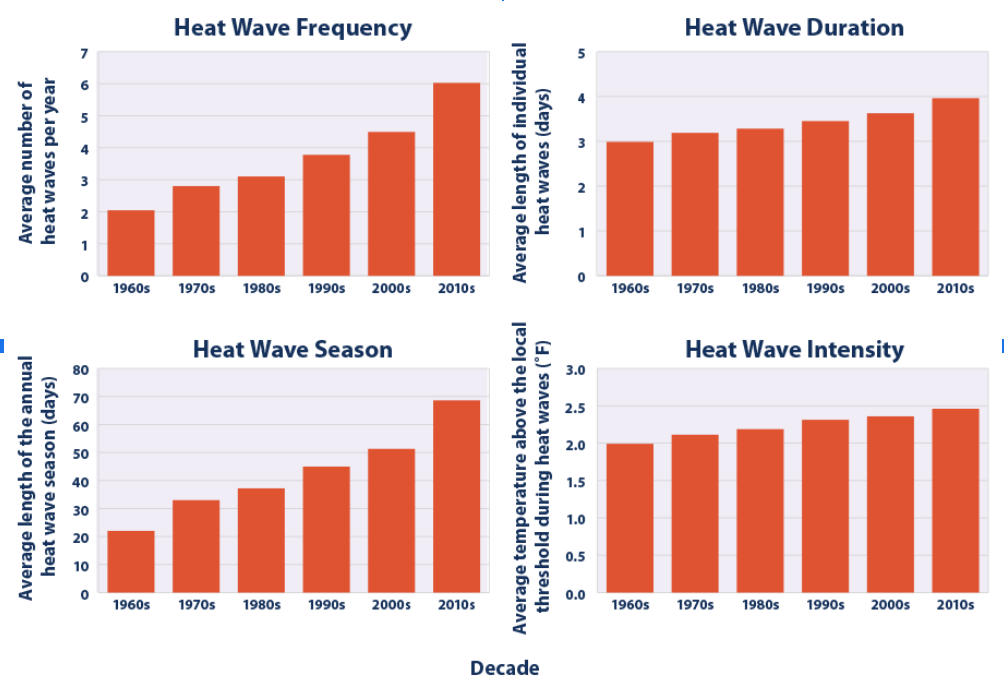
Heat wave characteristics over the last six decades showing an increase in frequency, length, and intensity since the 1960s in the United States (from US EPA).
How do heat waves affect people?
- Heat waves can create health risks such as cardiovascular issues, blood clots, respiratory problems, heat stroke, or even death. Extreme heat has been one of the leading causes of weather-related deaths in the United States (graph below).
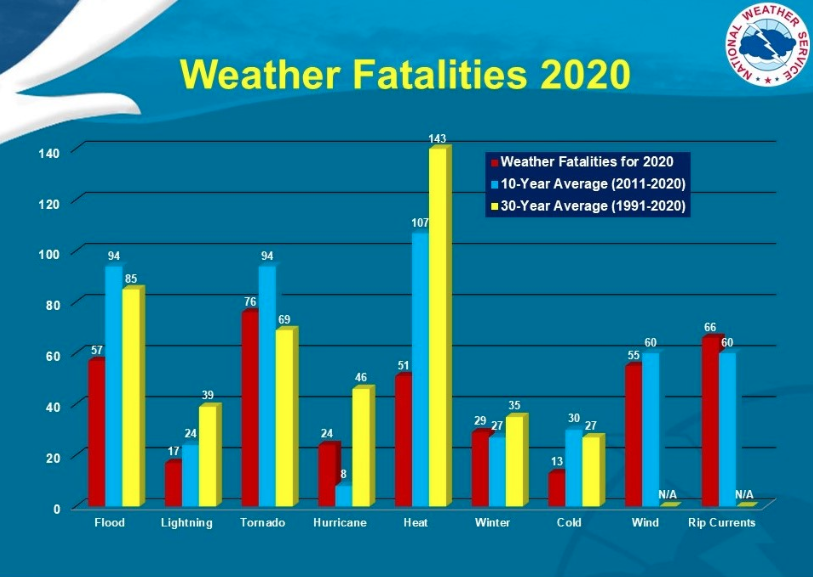
Number of weather-related fatalities in the United States 1991-2020. Note the high average values for heat-related fatalities (from National Weather Service, 2020).
How do heat waves affect the environment?
- Heat waves can cause droughts, wildfires, and heat stress that can destroy crops and affect food supply and agriculture.
- Heat waves also impact wildlife severely because they alter habitats and damage the health of animals by causing heat stress that can lead to severe illness and death (image below). With destroyed habitats animals are displaced and ecosystems are ruptured, which can result in more dire consequences such as extinctions of species.

In 2018 about 23,000 animals, many belonging to endangered species, in Australia died due to heat waves, including the flying fox bat pictured here (from Yale School of the Environment).
- Smith College Biology Professor Mariana Abarca studies the impact of heat waves on butterflies. Her research team found that winter warm spells, which are becoming increasingly common, result in drastic mortality of butterfly larvae in Maryland, USA. The researchers also discovered that feeding on invasive plants increases the vulnerability of butterflies to heat stress compared to feeding on native vegetation (image below).

Heat waves increase mortality of a wetland butterfly Baltimore Checkerspot (Euphydryas phaeton phaeton) (photo courtesy of Mariana Abarca).
Examples of major heat waves throughout history:
The Great North American heat wave of July 1936
- In the summer of 1936 blistering heat tore through the Upper Midwest, the Great Plains, and Great Lake states, and persisted for ten days with temperatures over 90°F (32°C). In some areas temperatures even reached a high of 108°F (42.2°C). This had devastating effects on crops in this region and resulted in over 5000 deaths.

Newspaper from St. Paul, Minnesota reported deaths caused by the intense heat in 1936 (from Pioneer Press, 2016).
Heat waves in Greece 1987-1988
- From 1987 to 1988 Greece experienced abnormally high summer temperatures that claimed the lives of many in a time and place where air conditioning wasn’t common. For 6-8 days straight temperatures reached a harsh 104°F (40°C) throughout the day and wouldn’t even drop below 86°F (30°C) at night. Many victims of the heat were elderly, and the deaths totaled to around 1300 people.
The European heat wave of 2003
- Record high temperatures, on average 20-30% higher than normal, swept across Europe in the summer of 2003. The UK and France reported extreme temperatures starting from a minimum of 95°F (35°C) to a high of 105.8°F (41°C). As a result, thousands of elderly people died, and 13 billion Euros worth of damages were reported due to droughts, forest fires, and affected ecosystems and agriculture.
The 2010 Eastern European/Russian heat wave
- In the summer of 2010, Eastern Europe was hit with extraordinarily high temperatures. The 2010 heat wave broke 500-year-old records for average summer temperatures and area of impact.
- The brunt of this heat was felt in Russia. Temperatures that summer rose between 6.7°C and 13.3°C above average with Moscow reaching a record-breaking 38.2°C during the daytime. The heatwave overall covered an area of around 2 million kilometers resulting in about 9 million hectares of crops being destroyed and triggering peat and forest fires that claimed lives. Russian officials estimate that the heat wave caused over 56,000 deaths.
The India heat wave of 2015
- During May of 2015, in anticipation of the upcoming monsoons, seasonal temperatures began to routinely increase to as high as 104°F (40°C) in India. However, unexpectedly temperatures soared past this average and peaked at around 117°F (47.2°C) in some areas for the entire week. The humidity made the high temperatures unbearable and as a result over 2000 human lives were lost.
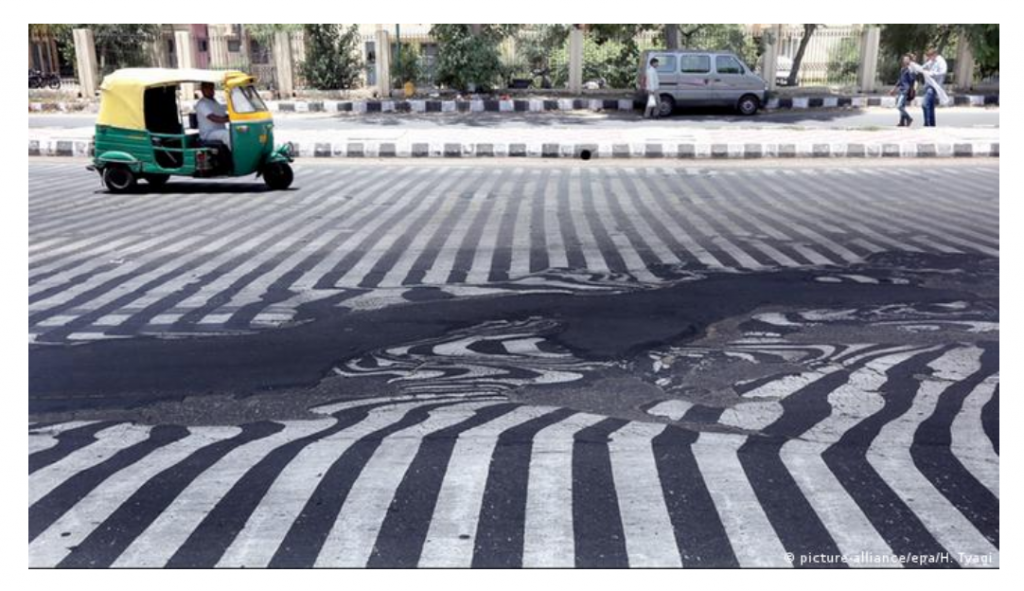
The extreme heat in 2015 in the capital of India, New Delhi, melted the roads (from DW News).
Heat waves of 2022
- India and Pakistan
- India and Pakistan experienced an extended, three-month-long heat wave during the spring of 2022. In May, daytime temperatures soared above 110°F (43°C) and nighttime temperatures stayed in the 90s (~35°C). Temperatures this high are not usually seen until later in the summer. Surging electricity use led to widespread power outages. Schools and businesses adapted to the heat by closing earlier, with the Indian government encouraging people to stay inside during the afternoon. This, unfortunately, is not an option for unhoused people (image below).
- The heat wave also triggered forest fires in India and an extreme flood in northern Pakistan when a lake overflowed with water from a rapidly melting glacier. At least 90 people died across India and Pakistan due to the heat wave. This relatively low death toll is attributed to low humidity, community adaptation and resilience, and incomplete reporting.
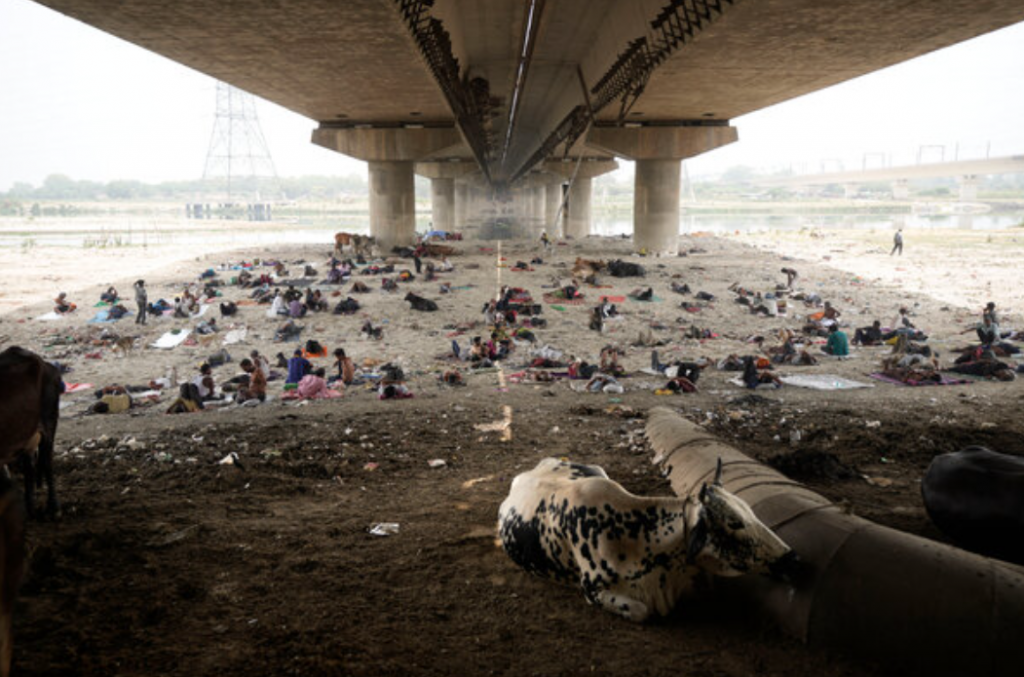
Homeless people sleep in the shade of a highway overpass on a hot day in New Delhi, India in May 2022 (from Manish Swarup/Associated Press via the New York Times).
- China
- In the summer of 2022, the average temperatures across China rose 1.2° higher than the seasonal norm reaching 22.4°C. These conditions combined with the third largest decrease in rainfall in China’s history caused widespread droughts that then resulted in forest fires that devastated southwestern China and East Tibet. Agriculture production, water systems, and power supply were all affected, especially the Yangtze River which is the source of drinking water for millions.
- This event was one of China’s most severe recorded heat waves. In the summer of 2022, China experienced more than 70 days of heat wave conditions, with some cities such as Chongqing and Sichuan reporting temperatures of over 40°C.
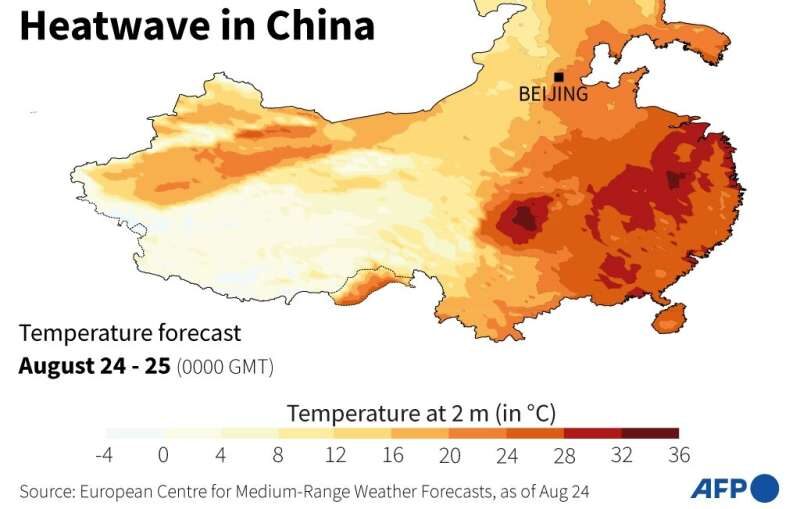
Temperature forecast in China from August 24-25, 2022 (from AFP News via Phys News).
- Europe
- Europe’s hottest summer on record took place in 2022, as it has been labeled by researchers the most impactful heatwave since the one that took place in 2003. The summer heat waves caused 20,000 excess deaths across France, Spain, Germany, and Britain. Some cities saw record-breaking temperatures of over 45°C. The heat wave also incited wildfires across Britain, France, and the Iberian Peninsula.
- Average temperatures in Europe have been increasing since 1961 at a pace of 0.5°C per decade. According to the World Health Organization, it is the fastest warming region in the world.
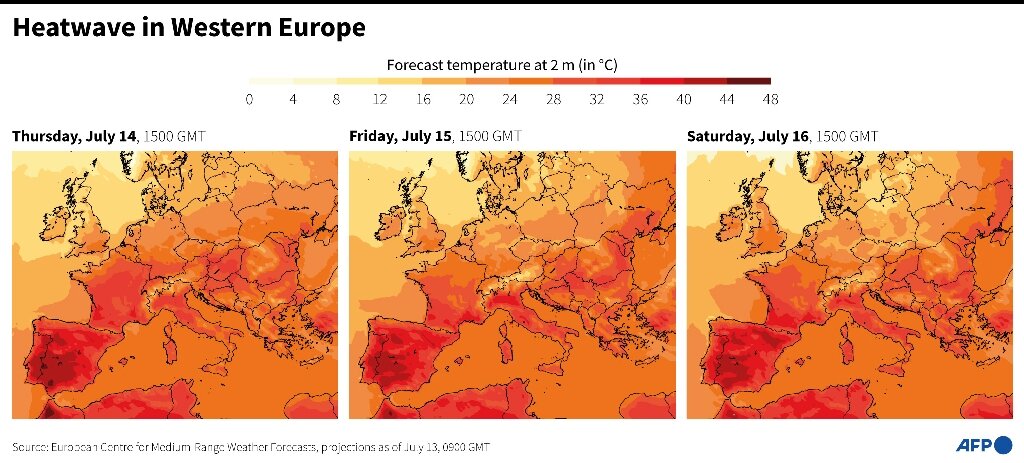
Temperatures in Europe From July 14 to July 16, 2022 (from AFP News via Phys News).
- North America
- August 2022 was North America’s hottest summer to date, and in the following month of September, hundreds of temperature records across the U.S. were broken due to intense heat waves. The western half of the U.S. in particular was extremely affected by the heat wave with California, for example, reaching a record-breaking temperature of 116°F (46.7°C) in Sacramento and Merced.
- 61 million people in total were under extreme weather advisory in Arizona, Nevada, and California.
Future heat waves
- Going forward, heat waves are predicted to become more common and intense worldwide due to anthropogenic climate change. Warming temperatures are increasing the frequency and intensity of El Niño events, periods of warm water in the Pacific Ocean. The Pacific Ocean is a major regulator of global temperature and precipitation. During El Niño, global weather systems are disrupted and heat is released into the atmosphere, contributing to increased heat waves.
- But some regions will be more impacted than others. Researchers have pinpointed Russia, Central America, central Europe, China, and Australia as the most vulnerable to future heat waves. Countries that have not historically experienced heat waves will be the most affected, as they do not have pre-existing infrastructure to combat rising temperatures. However, with prior preparation and adaptive measures, the effects of heat waves can be reduced.
Climate inequality leads to disparity in who suffers from heat waves
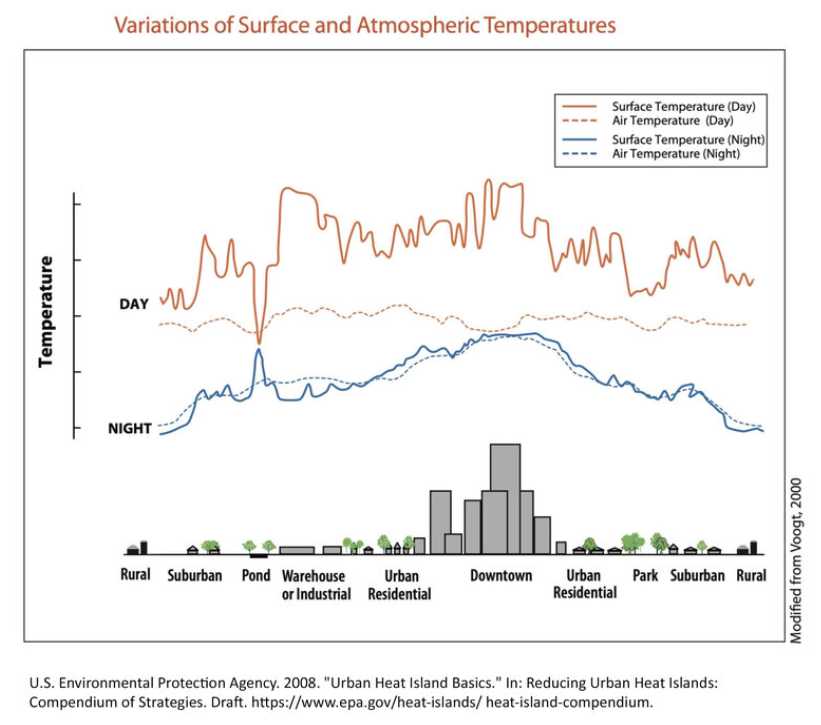
- Large cities in particular suffer under heat waves due to the “urban heat island effect” (images below), which occurs when natural land cover is replaced with pavement, buildings, and other surfaces that preferentially absorb and retain heat. As climate change worsens heat waves, the disparity in who suffers from these events increases as well. For example, in New York City, the effects of the heat differ between neighborhoods:
- Wealthy neighborhoods have more green space, including tall trees that provide shade, while poor neighborhoods have fewer trees and less access to recreational green space. Without trees to provide shade and natural cooling, paved sidewalks and roads get extremely hot in summer months.
- Wealthy New Yorkers are more likely to have air conditioning, as well as the means to escape the city for the beach, lakes, or forests. Public spaces in New York do not serve everyone equally, either: to access public pools in the summer, New Yorkers have to wait in line, sometimes for hours, and there are more pools per capita in white, wealthy boroughs. Black New Yorkers are more than twice as likely to die from heat as white residents.

Artist Alisa Singer creates colorful visual art to showcase alarming climate trends, such as the unequal impact of heat waves in urban areas. Singer’s digital art piece “Urban Heat Islands” (above) is paired with graphs (below) explaining the science behind the issue. These graphs show elevated air and surface temperature in urban areas compared to rural areas (from Environmental Graphiti).
References and additional resources
- Abarca, M., Larsen, E. A., and Ries, L. “Heatwaves and Novel Host Consumption Increase Overwinter Mortality of an Imperiled Wetland Butterfly.” Frontiers in Ecology and Evolution, vol. 7, 2019. https://www.frontiersin.org/article/10.3389/fevo.2019.00193.
- Barnard, A., Kilgannon, C., Hughes, J., and Goldberg, E. “It’s going to be a hot summer. It will be hotter if you’re not rich.” The New York Times. June 2022. https://www.nytimes.com/2022/05/28/nyregion/heat-waves-climate-change-inequality.html.
- Celis, N. “Half of China hit by drought in worst heatwave on record.” Phys.org. 2022. https://phys.org/news/2022-08-china-drought-worst-heatwave.html.
- Chasan, A. “Scientists identify regions where heat waves may cause most damaging impact in coming years.” CBS News. 2023. https://www.cbsnews.com/news/heat-waves-records-risky-countries-climate-change/.
- Chrysopoulos, P. “Extremely high temperatures in Greece bring back memories of 1987 killer heatwave.” Greek Reporter. February 2021. https://greekreporter.com/2017/06/29/extremely-high-temperatures-in-greece-brings-back-memories-of-1987-killer-heatwave/.
- “Climate Change Indicators: Heatwaves.” US Environmental Protection Agency. April 2021. https://www.epa.gov/climate-indicators/climate-change-indicators-heat-waves.
- Di Liberto, T. “India Heat Wave kills thousands.” NOAA. June 2015. https://www.climate.gov/news-features/event-tracker/india-heat-wave-kills-thousands.
- ETH Zürich. “Record-breaking 2010 Eastern European/Russian heatwave.” ScienceDaily. 2011. https://www.sciencedaily.com/releases/2011/03/110318091141.htm.
- “Extreme heat can impact our health in many ways.” CDC. 2021. https://www.cdc.gov/climateandhealth/pubs/extreme-heat-final_508.pdf.
- Giles, B. D. and Balafoutis, C. J. “The Greek heatwaves of 1987 and 1988.” International Journal of Climatology. 1990. https://rmets.onlinelibrary.wiley.com/doi/epdf/10.1002/joc.3370100507.
- Gutterman. S. “Heat, smoke sent Russia deaths soaring in 2010: govt.” Reuters. 2010. https://www.reuters.com/article/us-russia-heat-deaths-idUSTRE69O4LB20101025.
- “Heatwave of July 1936.” National Weather Service. November 2019. https://www.weather.gov/arx/heat_jul36.
- “Impacts of summer 2003 heat wave in Europe.” Environmental Alert Bulletin. March 2004. https://www.unisdr.org/files/1145_ewheatwave.en.pdf.
- “India heat wave death toll surpasses 1,800, crisis response questioned.” DW. May 2015. https://www.dw.com/en/india-heat-wave-death-toll-surpasses-1800-crisis-response-questioned/a-18484289.
- Irfan, U. “A big El Niño is looming. Here’s what it means for our weather.” Vox. May 2023. https://www.vox.com/climate/23738846/el-nino-2023-weather-heat-wave-climate-change-disaster-flood-rain.
- Irfan, U. “The extraordinary heat wave in India and Pakistan, explained.” Vox. May 2022. https://www.vox.com/23057267/india-pakistan-heat-wave-climate-change-coal-south-asia.
- Kirkpatrick, S. E. and Gibson, P. B. “Changes in regional heatwave characteristics as a function of increasing global temperature.” Scientific Reports. September 2017 https://www.nature.com/articles/s41598-017-12520-2.
- Lopez, G. “Good morning. Climate change’s effects are already unequal.” The New York Times. June 2022. https://messaging-custom-newsletters.nytimes.com/template/oakv2?campaign_id=9&emc=edit_nn_20220602&instance_id=62964&nl=the-morning&productCode=NN®i_id=121508962&segment_id=93971&te=1&uri=nyt%3A%2F%2Fnewsletter%2Fb8852300-e224-59a8-9f4a-770ae48e5178&user_id=e9b5b2ca771f2aa9ddf4b48678d5aeae .
- Perroteau, T. “Western Europe heatwave to peak in scorching Spain.” Phys.org. 2022. https://phys.org/news/2022-07-western-europe-heatwave-peak-spain.html.
- Plumer, B. and Popovich, N. “How Decades of Racist Housing Policy Left Neighborhoods Sweltering.” The New York Times. August 2020. https://www.nytimes.com/interactive/2020/08/24/climate/racism-redlining-cities-global-warming.html.
- Portala, J. “Europe’s heatwave may have caused more than 20,000 ‘excess’ deaths.” Reuters. https://www.reuters.com/business/cop/europes-heatwave-may-have-caused-more-than-20000-excess-deaths-2022-11-24/.
- “Reduce Urban Heat Island Effect.” EPA. March 2022. https://www.epa.gov/green-infrastructure/reduce-urban-heat-island-effect#:~:text=%22Urban%20heat%20islands%22%20occur%20when,heat%2Drelated%20illness%20and%20mortality.
- Rice, D. “Fierce heat wave in India and Pakistan 30 times more likely because of climate change.” USA Today. May 2022. https://www.usatoday.com/story/news/world/2022/05/23/india-palistan-heat-wave-climate-change/9895396002/.
- Robbins, J. “With Temperatures Rising, Can Animals Survive the Heat Stress?” Yale Environment 360. March 2020. https://e360.yale.edu/features/with-temperatures-rising-can-animals-survive-the-heat-stress.
- Siebart, S. and Ewert, F. “Future crop production threatened by extreme heat.” Environmental Research Letters. April 2014. https://iopscience.iop.org/article/10.1088/1748-9326/9/4/041001.
- Singer, A. “Urban Heat Islands.” Environmental Graphiti. 2021. https://www.environmentalgraphiti.org/all-series/urban-heat-islands.
- “The Russian Heatwave of Summer 2010.” Met Office, https://www.metoffice.gov.uk/weather/learn-about/weather/case-studies/russian-heatwave.
- Wallace-Wells, D. “The Mysteriously Low Death Toll of the Heat Waves in India and Pakistan.” The New York Times. 2022. https://www.nytimes.com/2022/07/14/opinion/environment/heat-waves-india-pakistan-climate-change.html.
- “Weather related fatality and injuries.” National Weather Service. 2020. https://www.weather.gov/hazstat/.
- “What is a heat wave?” SciJinks. November 2021. https://scijinks.gov/heat/.
- Woltman, N. “Killer heatwave cooked a confession out of St. Paul kidnapper in 1936.” Twin Cities.com: Pioneer Press. July 2019. https://www.twincities.com/2016/07/14/pioneer-press-1936-heat-wave-st-paul/.
- Yu, V. “China reports ‘most severe’ heatwave an third driest summer on record.” The Guardian. 2022. https://www.theguardian.com/world/2022/sep/07/china-reports-most-severe-heatwave-and-lowest-rainfall-on-record.