Section 4.6: Di-An Equilibrium Diagram
The crystallization of igneous rocks from a magma due to cooling is very similar to the crystallization of water-salt brines due to cooling.
Figure 4.10 is a composition vs.
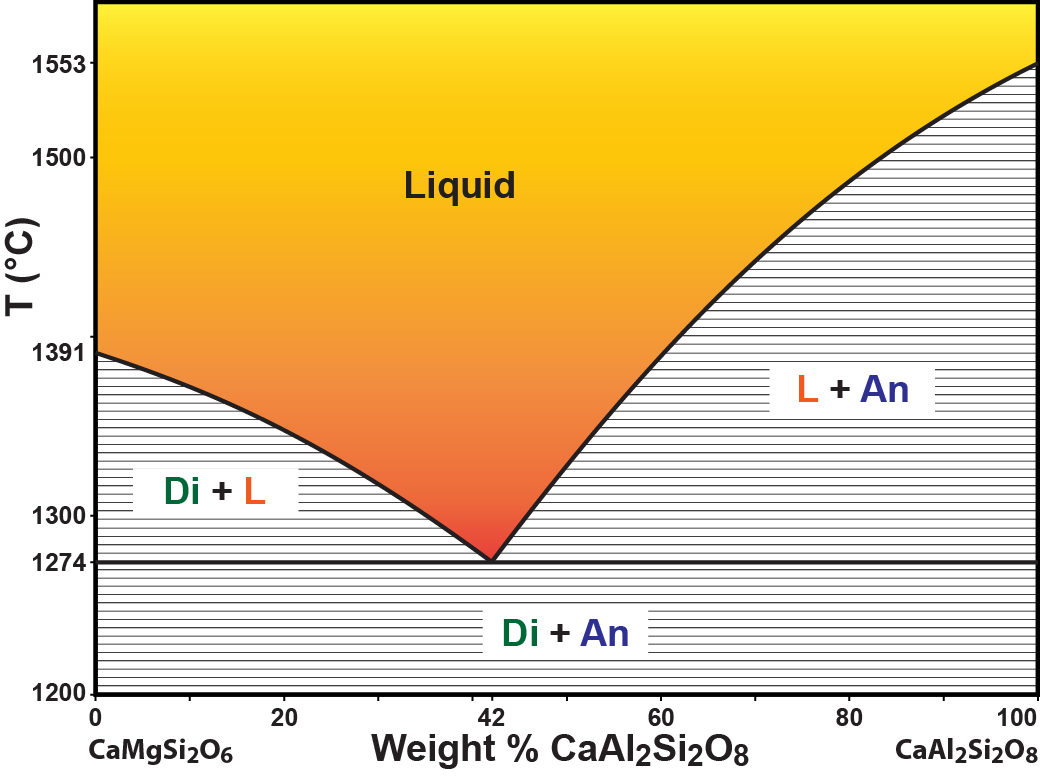
Figure 4.10. CaMgSi2O6-CaAl2Si2O8 equilibrium phase diagram. Phases at equilibrium are shown as a function of chemical composition (weight percent CaAl2Si2O8) and temperature. The orange area indicates temperatures and compositions for which a single phase, magma, is present at equilibrium. Click on the diagram to se an enlarged version for more information.
temperature phase diagram for a simplified basaltic magma made from a mixture of diopside (CaMgSi
2O
6) and anorthite (CaAl
2Si
2O
8).Notice how similar
Figure 4.10 looks to
Figure 4.09. Both diagrams have a colored region that idenifies chemical compositions and temperatures that yield a single liquid at equilibrium. The liquid region is bounded by curved black saturation curves. The 3 areas that are filled with a horizontal line pattern idenify chemical compositions and temperatures that yield a mixture of two phases at equilibrium. The identities of the two phases are given by the written labels, but could be deduced from the boundaries of the region. The horizontal line patterns represent tie lines that connect the compositions of pairs of phases at equilibrium at specific temperatures. The two saturation curves meet at a special point that identifies the chemical composition of the liquid that is saturated with
two solids at the lowest temperature the liquid can exisit.
(42 weight percent CaAl
2Si
2O
6)both with diopside and anorthite at 1274°C.