
Content warning: This song contains content pertaining to implied war and violence that may not be fit for certain audiences.
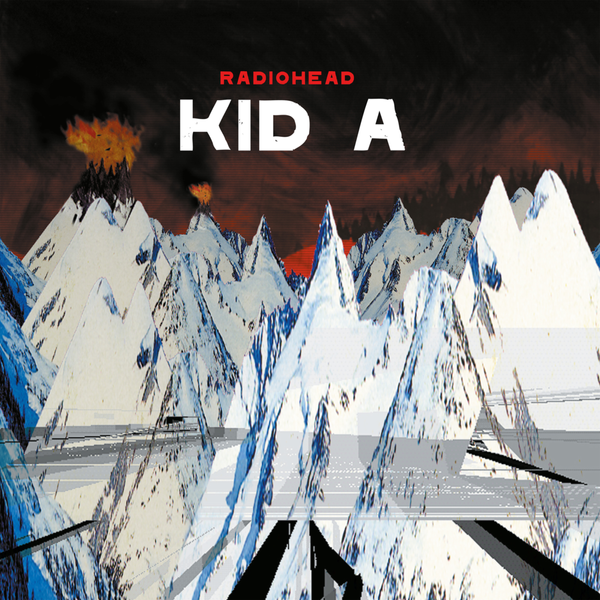
Album cover for Kid A by British rock band Radiohead, released in 2000 (from Genius, 2010). It features illustrations of barren glaciers, some of which are burning, to demonstrate the apocalyptic content referenced in some of the songs.
- “Idioteque” was released by British rock band Radiohead in October 2000 as part of their fourth studio album Kid A. One of Radiohead’s most critically acclaimed songs, “Idioteque,” is an experimental electronic beat, unlike the band’s usual alternative rock sound.
- In addition to their musical artistry, Radiohead is known for their politicized lyrics and social commentary. For instance, their third album OK Computer (1997), featured a critique of Western society surrounding issues of overreliance on technology and mental health. The message of “Idioteque” is equally strong and compelling.
- You can listen to the song here and read the lyrics here.
How is this related to climate?
- “Idioteque,” tells the story of a fictional apocalyptic wasteland created by a nuclear Ice Age. While band members have not explicitly come out and explained the exact meaning behind the lyrics, the song has been attributed to anthropogenic climate change. It offers a vision of the world ravaged by human destruction.
- The first verse describes women and children in a bunker, taking shelter from the treacherous conditions of the frozen wasteland. The second verse includes the lines, “Ice Age coming, Ice Age coming, throw him in the fire.” Here, Radiohead explores the consequences of a nuclear war on the global climate system. “Ice Age” refers to the prolonged period of global cooling that would follow a nuclear war. “Fire” possibly refers to massive fires caused by the blasts.
- Burning of asphalt, concrete, and other building materials in metropolitan areas would produce sooty smoke containing black carbon, which absorbs solar radiation very efficiently. The thick smoke would not allow solar radiation to penetrate through the atmosphere, causing surface temperatures to plummet (image below), similar to the short-term effects of volcanic eruptions.
Diagram of the effects of nuclear war on the environment and climate (from How It Works Team, 2015). The illustrations of the ash cloud and incoming sunlight demonstrate how smoke from nuclear fires absorbs solar radiation high in the atmosphere, causing surface temperatures to drop.
-
- The concept of nuclear winter was first introduced in the 1980s, during the height of the Cold War between the U.S. and the Soviet Union. In 1983, American scientist Dr. Carl Sagan, along with his collaborators, released a study modeling the climatic effects of a nuclear war. They found that such a war would trigger a nuclear winter. In this event, global temperatures would drop, and the planet would no longer be able to support agriculture.
- A 2019 study published in the Journal of Geophysical Research predicted the impact of the U.S. and Russia’s nuclear arsenals on global temperatures and precipitation using an updated climate model (maps below). The model calculated that global surface temperatures would drop an average of 10°C (18°F) and surface solar radiation would decrease by 75% for the first few years of a nuclear winter. Precipitation patterns would also transform. Monsoon cycles would halt and subtropical deserts would receive increased rainfall. All of these altered climate factors would make agriculture nearly impossible for at least 15 years.
- For these reasons, many of the world’s most powerful nations agree that nuclear war must never happen. In January 2022, the U.S., Russia, China, the U.K., and France signed a pledge agreeing to avoid nuclear war at all costs. The global nuclear powers committed to preventing disagreements from escalating to nuclear conflicts.
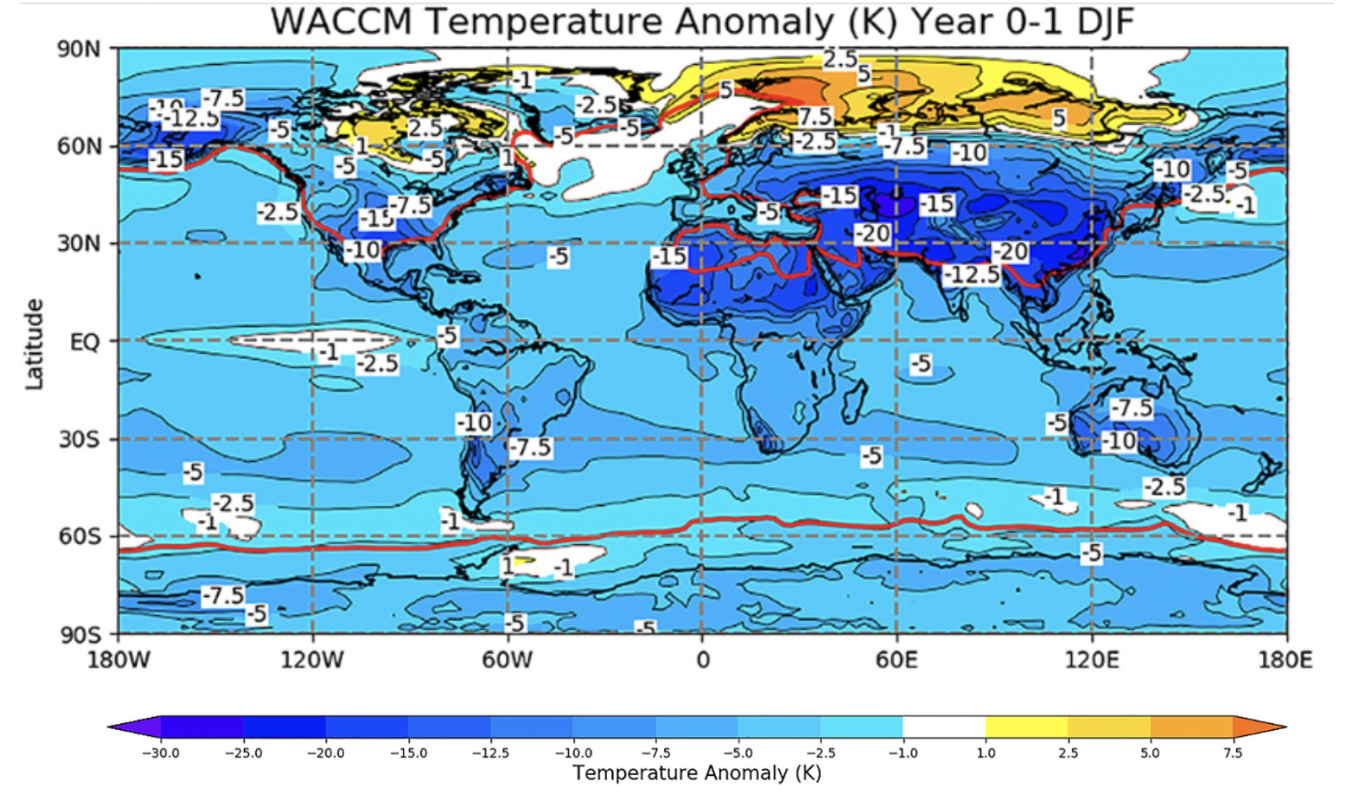
Map of global temperature changes one year after a simulated nuclear war between the U.S. and Russia. Warmer colors indicate a rise in temperature, and cooler colors indicate a drop in temperature (from Coupe et al., 2019). The labels on the map and scale describe the temperature change in degrees Kelvin (same as degrees Celsius). Notice the consistent drop in temperatures worldwide, except in the Arctic.
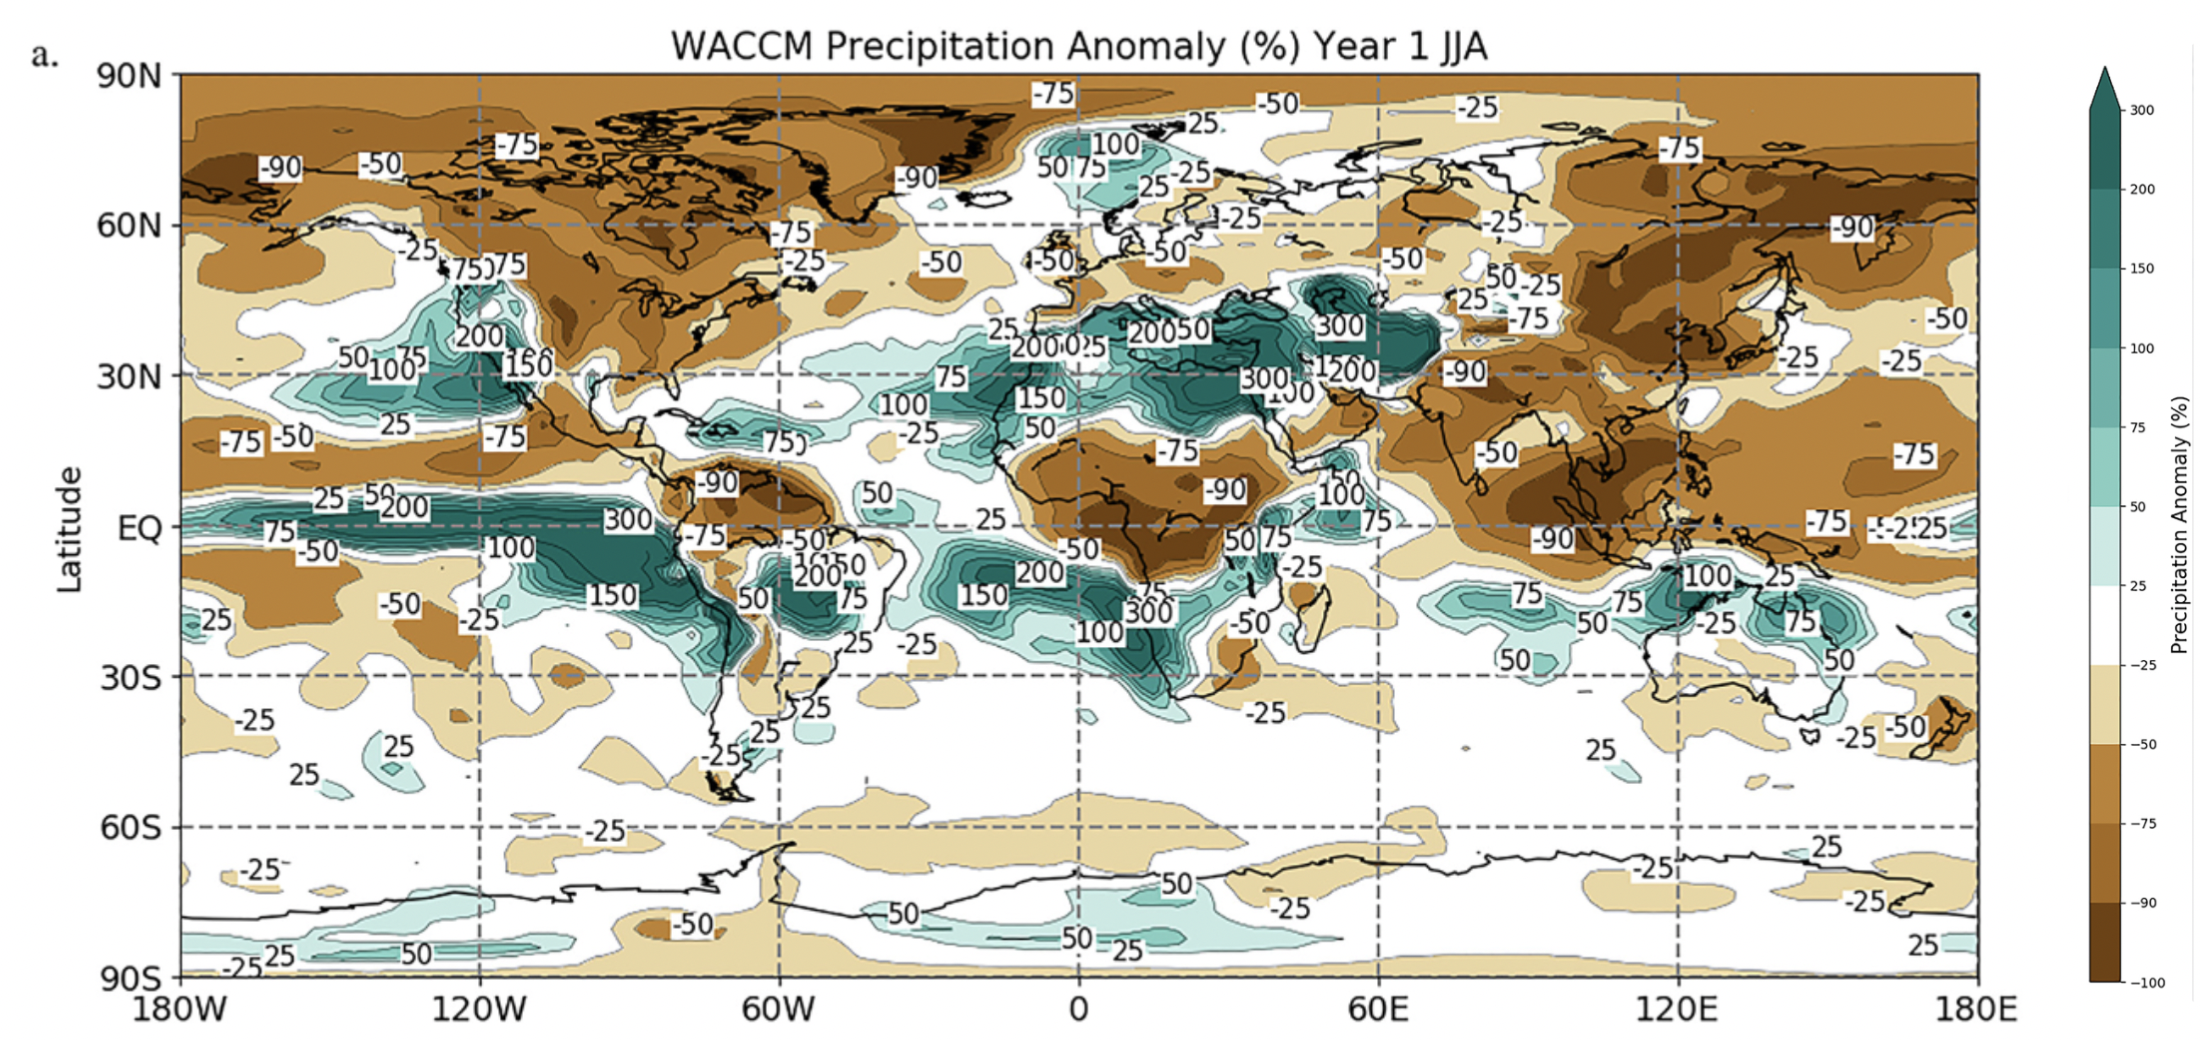
Map of precipitation changes one year after a simulated nuclear war between the U.S. and Russia. Brown color indicates a drop in annual precipitation, and blue-green indicates an increase in annual precipitation (from Coupe et al., 2019). The labels on the map and scale indicate the percent change in precipitation compared to 2019 levels.
Resources and additional resources
- Arablouei, R. Adbdelfatah, R. “20 Years After The End Of The World.” NPR Music. December 2021. https://www.npr.org/2021/12/09/1062519603/radiohead-kid-a-amnesiac-throughline-thom-yorke-stanley-donwood.
- Borger, J. “Five of world’s most powerful nations pledge to avoid nuclear war.” The Guardian. January 2022. https://www.theguardian.com/world/2022/jan/03/five-nations-pledge-avoid-nuclear-war.
- Clément, G. “Activism and Environmentalism in British Rock Music: the Case of Radiohead.” Open Edition Journals. 2017. https://journals.openedition.org/rfcb/1499.
- Coupe, J. Bardeen, C.G., Robock, A. Toon, O. “Nuclear Winter Responses to Nuclear War Between the United States and Russia in the Whole Atmosphere Community Climate Model Version 4 and the Goddard Institute for Space Studies ModelE.” Journal of Geophysical Research. July 2019. https://agupubs.onlinelibrary.wiley.com/doi/10.1029/2019JD030509.
- Derouin, S. “Nuclear WInter May Bring a Decade of Destruction.” Eos Magazine. September 2019. https://eos.org/articles/nuclear-winter-may-bring-a-decade-of-destruction.
- Hansen, I. “How would nuclear war affect the climate?” NASA. February 2011. https://climate.nasa.gov/news/483/how-would-nuclear-war-affect-the-climate/.
- How It Works Team. “7 cataclysmic ways the world might end.” How It Works. April 2015. https://www.howitworksdaily.com/7-cataclysmic-ways-the-world-might-end/.
- “Idioteque.” Genius. 2010. https://genius.com/Radiohead-idioteque-lyrics.
- Pappas, S. “What happens when a nuclear bomb explodes?” Live Science. March 2022. https://www.livescience.com/what-happens-in-nuclear-bomb-blast.
- Radiohead. “Idioteque.” Youtube. April 2016. https://www.youtube.com/watch?v=svwJTnZOaco.
- Roane, K. “How the Threat of Nuclear Winter Changed the Cold War.” Pulitzer Center. April 2016. https://pulitzercenter.org/stories/how-threat-nuclear-winter-changed-cold-war.
- The Editors of Encyclopaedia Britannica. “Nuclear winter.” Encyclopedia Britannica. June 2023. https://www.britannica.com/science/nuclear-winter.