


Al2SiO5 stability diagram. Equilibrium Temperature (T)-Pressure (P) stability of three crystalline phases (polymorphs) with the chemical composition Al2SiO5: andalusite (And), kyanite (Ky), and sillimanite (Sil). Notice that only one Al2SiO5 phase is stable at a time, except for the special conditions indicated by the black reaction curves for which two phases are stable. All three phases are stable together only at the special "triple point" (marked by a red dot) where all three black lines intersect (T=545°C, P=0.46 GPa). The diagram and data are derived from the thermodynamic model dataset SPaC (version 2015) developed originally by Spear and Cheney (1989), which uses the Pattison (1992) triple point.
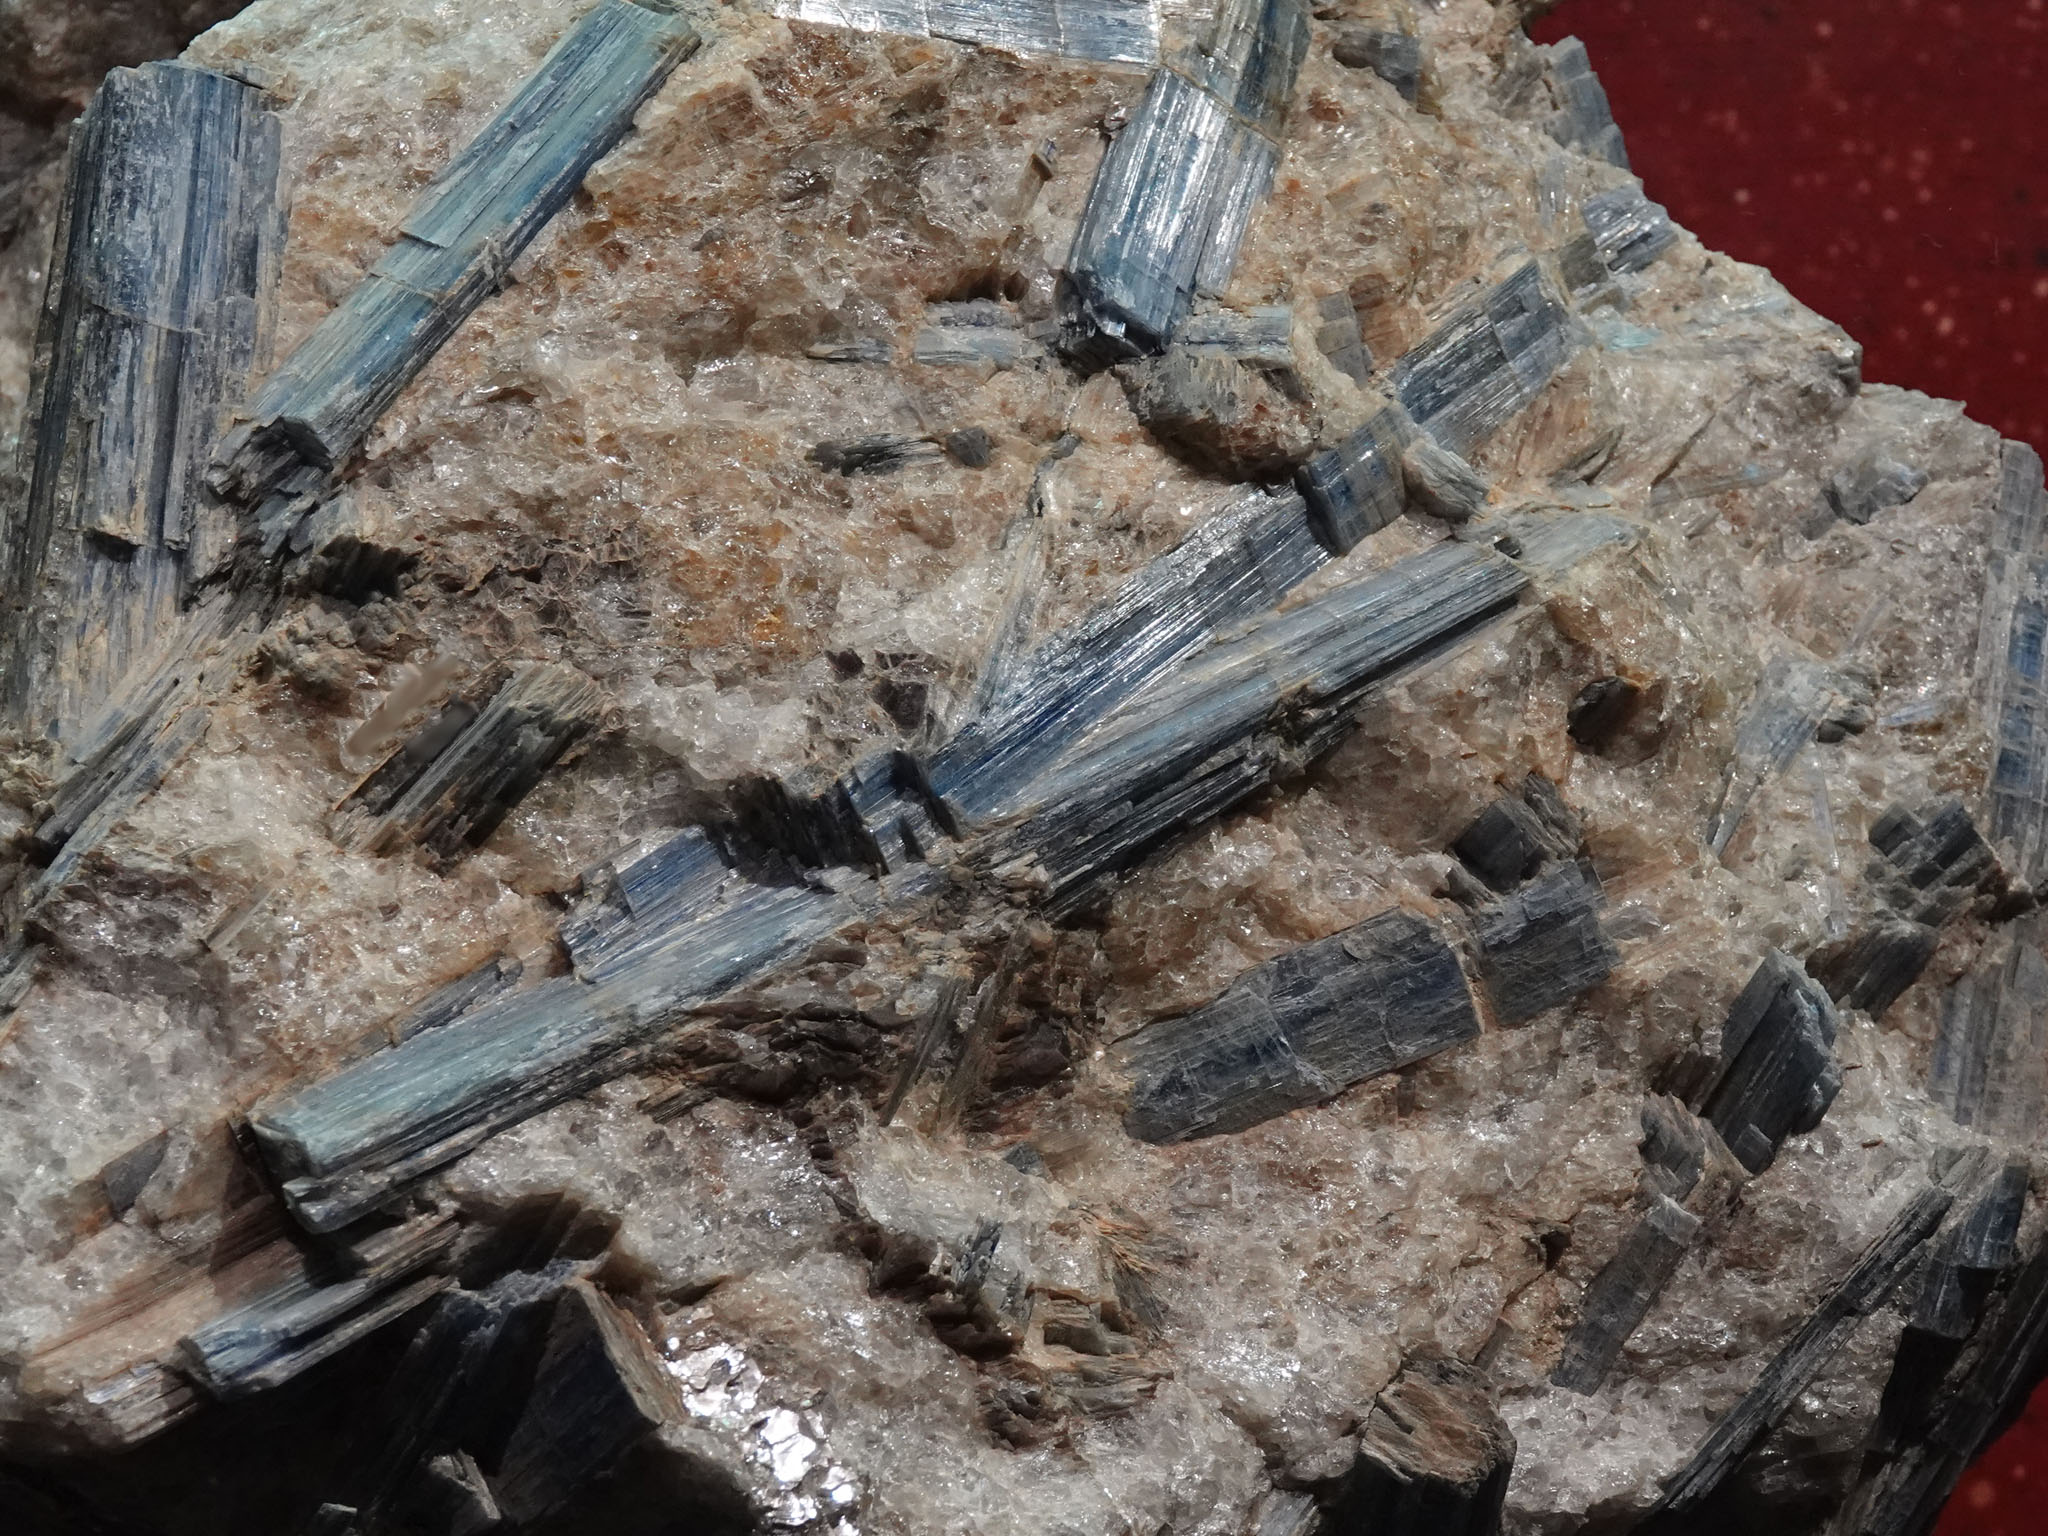
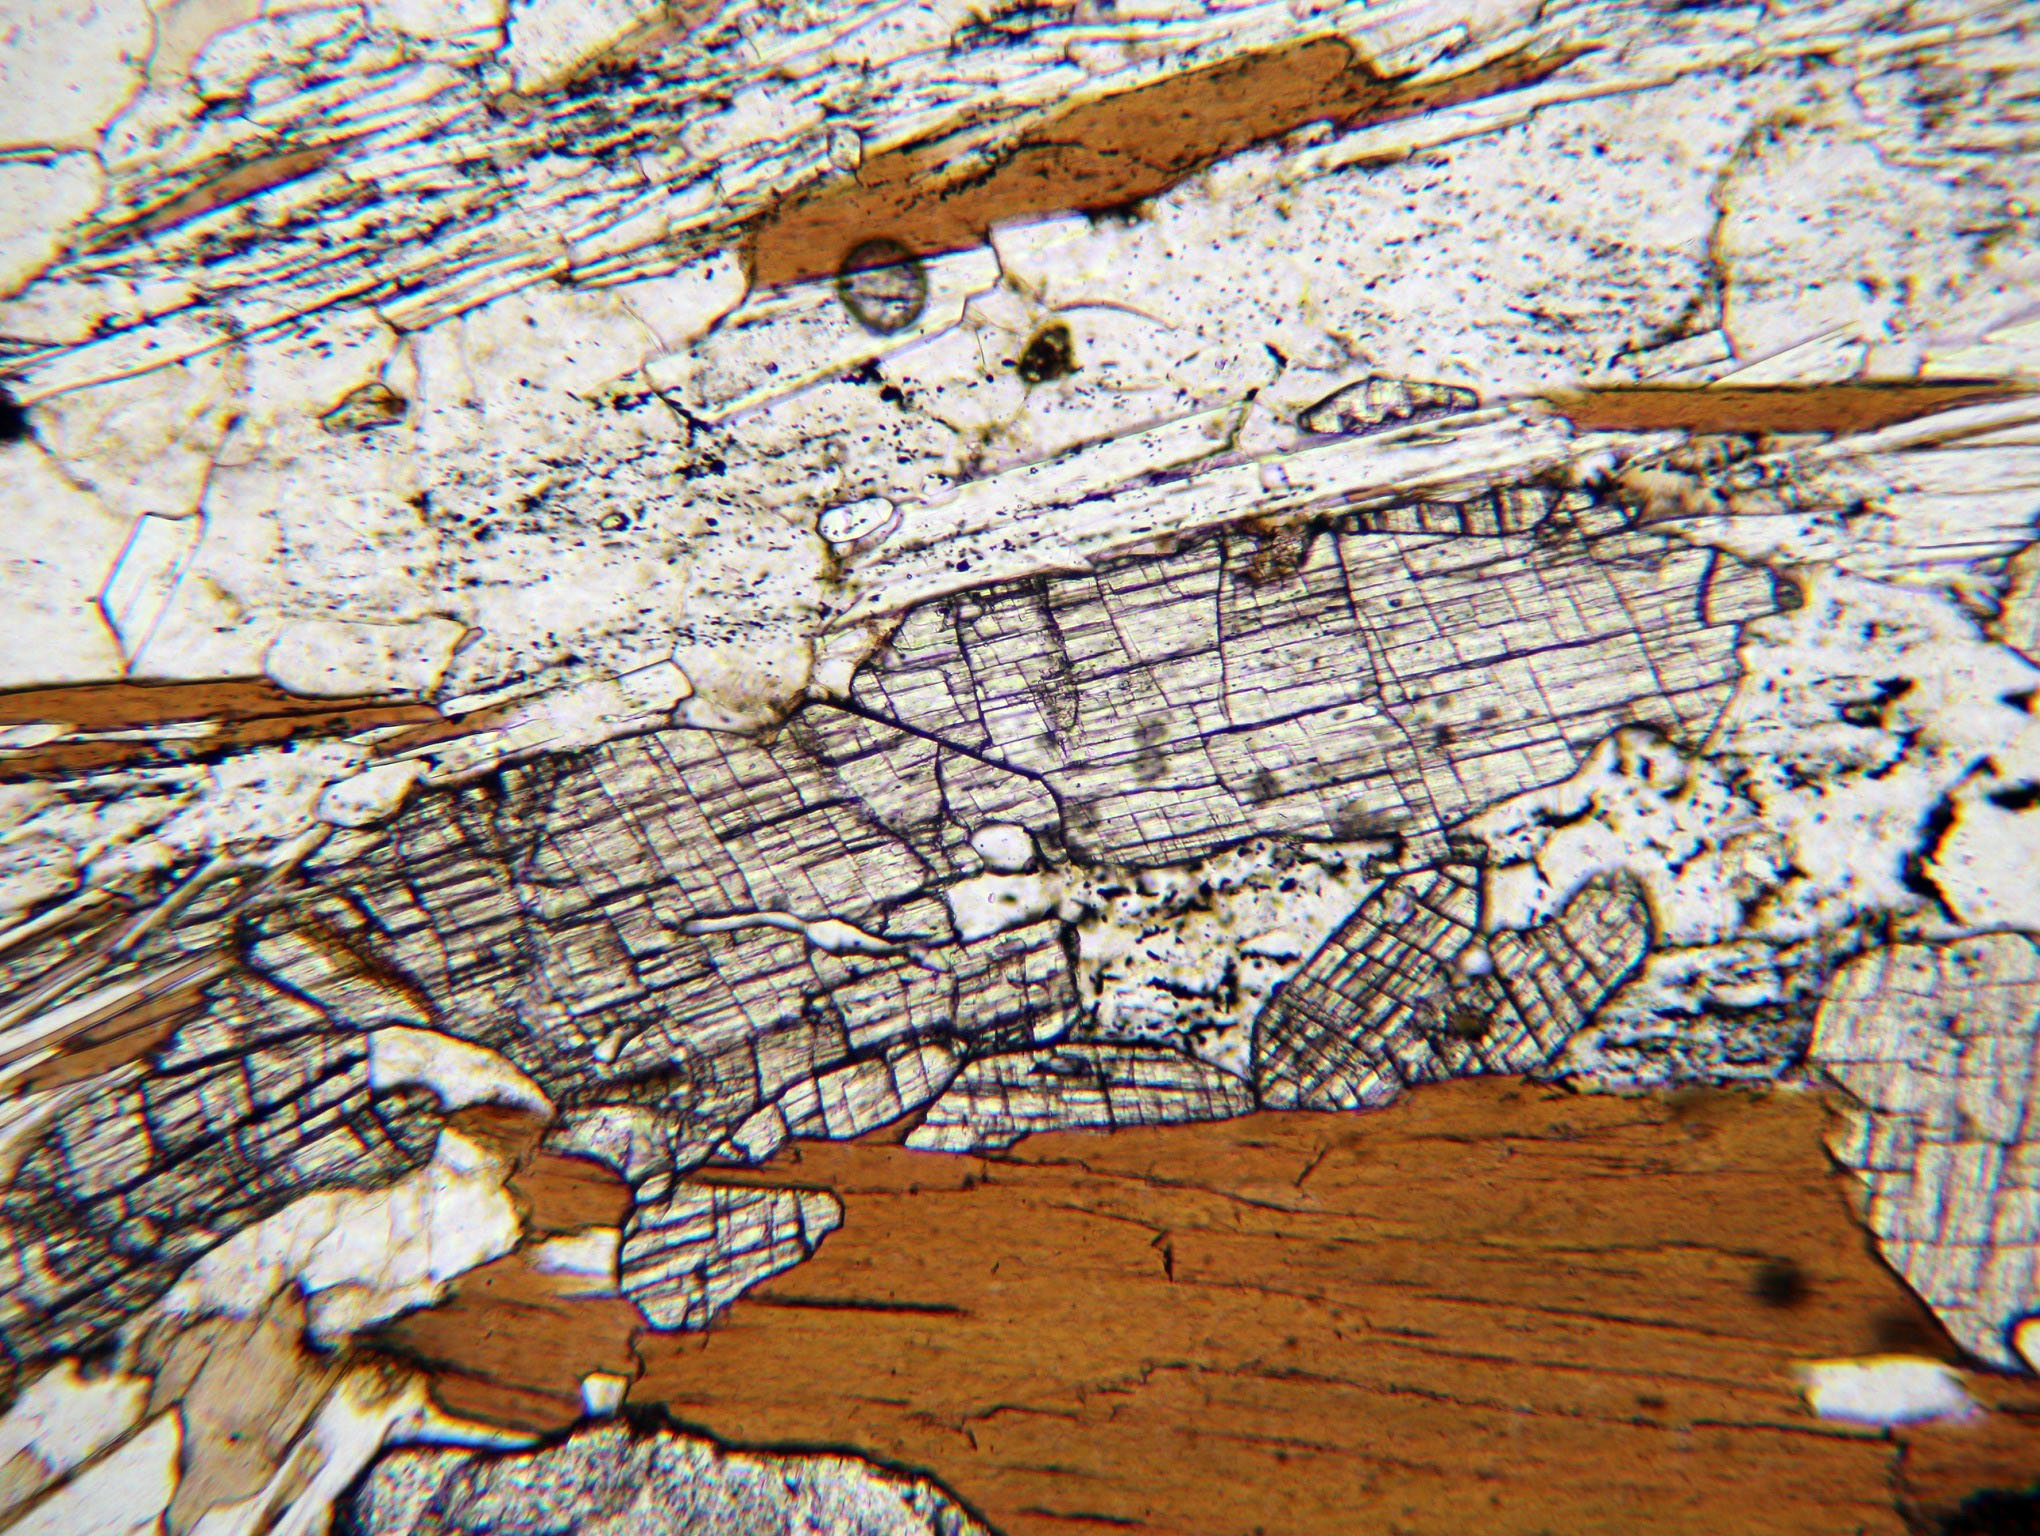
As you mouseover the P-T diagram, the stable phase indicated on the diagram is shown on the right. Both hand sample and thin section images of the stable mineral are shown. You can click on the diagram to fix the T and P. Then click on the "Change TP" button to resume animation. When the animation is paused, mousover the mineral images to enlarge them.