By Kate Nash ’23
In resurrecting the Tofurkey map for another year, I wanted to try out new techniques to make the map exciting, engaging, and user-friendly. StoryMaps provides an easy to build website creation platform, but for this year, I wanted to try Esri’s newer option, Experience Builder. This tool allows more interaction and customizability while still integrating data and maps into an app or website.
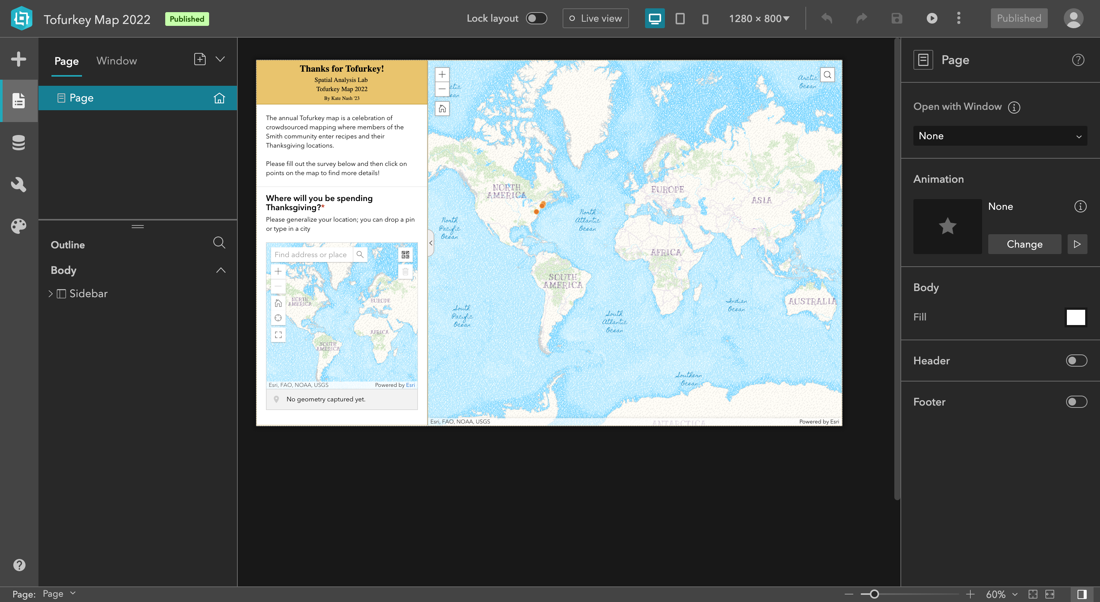
By using Survey123 and ArcGIS Online to make the survey and map, the combination of these three products was simple, as there is a survey widget and a map widget which allow for integration of these items. What proved to be more difficult was trying to add popups and more features, which were ultimately tossed aside in favor of simplicity and clarity for users.
There are many tools for customization and modification which allow for specific themes, such as the celebration of Tofurkey, to be embraced. In addition, the ability to add movement – both scrolling and sidebars – allowed for a streamlined and clean design.
In general, Experience Builder is especially great for existing data sets where the data can be imported into popups and tabs. For maps that are updating in real time, these features are less helpful. Experience Builder provides more flexibility and creativity than scrolling through a StoryMap and can be a great way to provide interactivity and multiple levels of data to a project.
