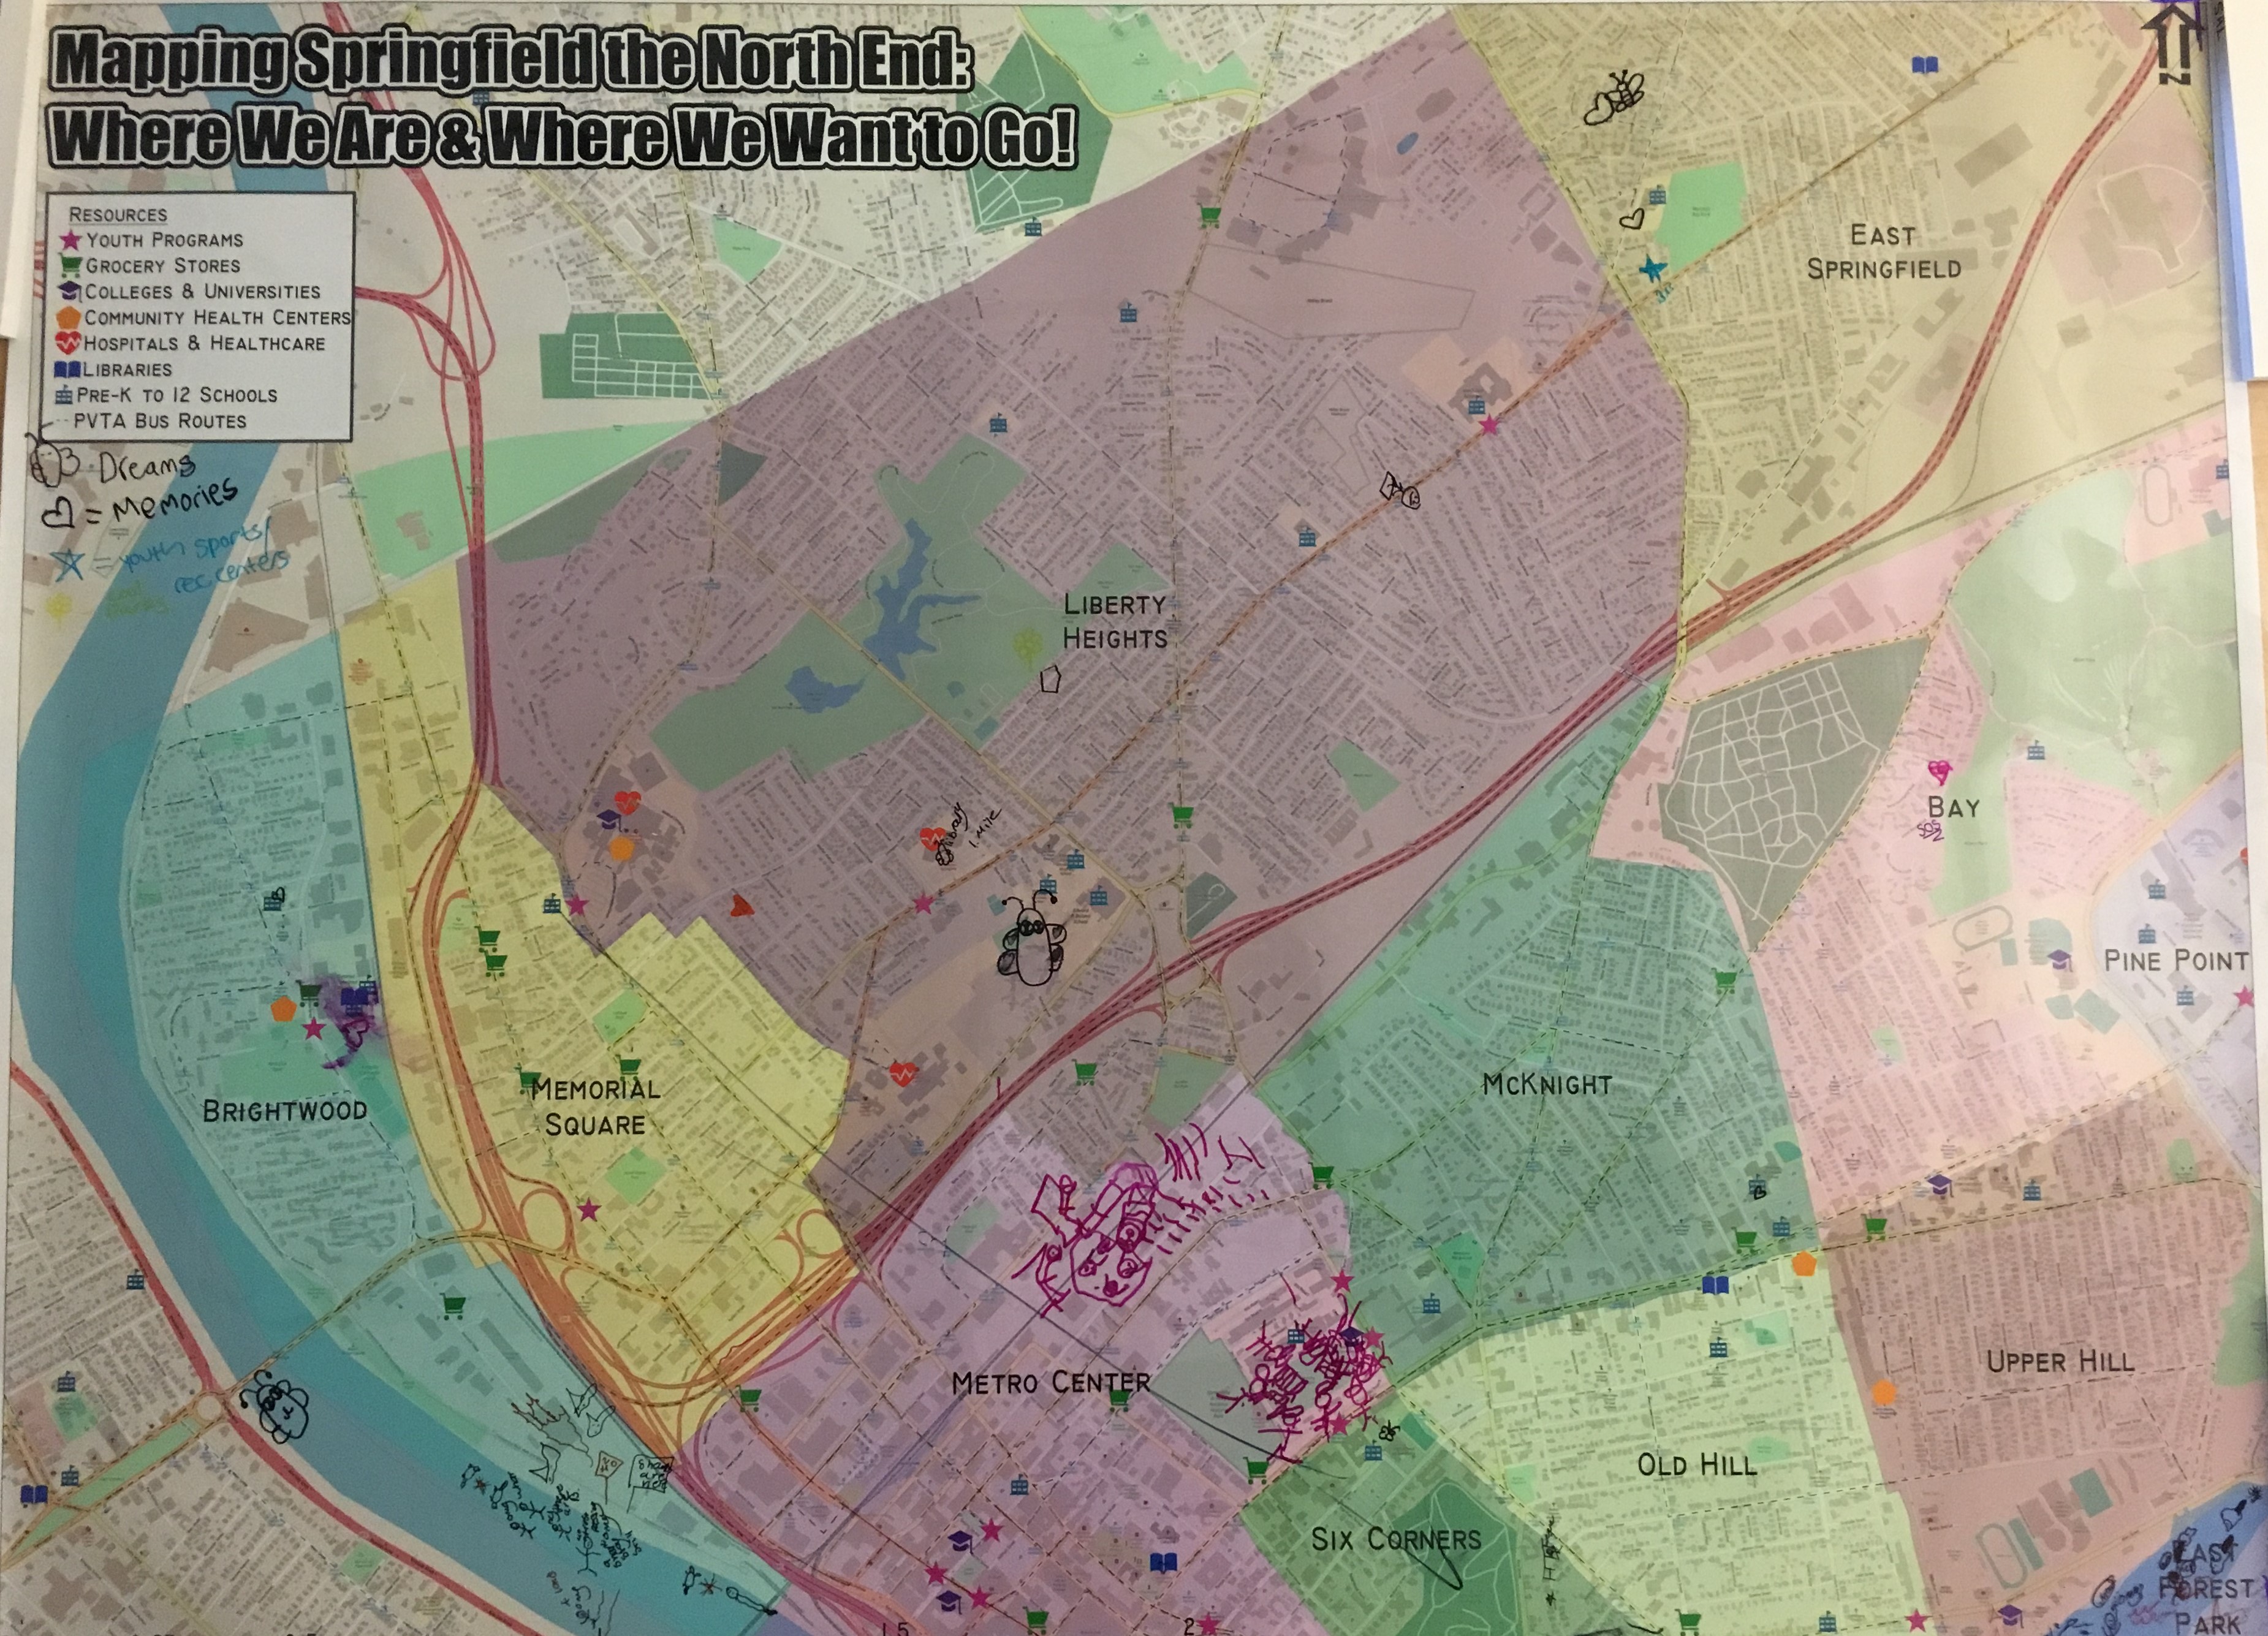
Project SPARC (Springfield Participatory Action Research Crew) and the Jandon Center invited the SAL to participate in their community event at Chestnut School in Springfield. We came to the event with two maps of Springfield that highlight various resources throughout the city– schools, universities, hospitals, community health centers, libraries, and youth programs– to help participants orient themselves and visualize their neighborhoods. I also came with the Highlander Center’s “Mapping Our Futures: Economics and Governance” curriculum to provide a foundation for the activity. They suggested to have questions posted to explore while working with their maps– I adapted them slightly for our purposes to say:
What do you see? On the map mark places:
- You like about your community
- You find helpful resources
- You like to gather and hang out
- That have power — institutions, groups, people
- You want to see change about your community
The event itself went great– there were many families that came and had fun at the various stations and enjoyed delicious food! I set up the maps on tables, laid out pre-measured yarn to create movable scales, and lots of different colored permanent markers. A steady flow of people moved throughout the activities and made their marks on the maps– we had lots of fun looking at the neighborhoods of Springfield, and usually someplace sparked a memory to share.
Some of the first people at the mapping station decided to add a heart to the legend to represent memories and a butterfly to represent dreams of change in specific places. People gravitated towards adding symbols on the map rather than annotating the maps. Most of the hearts were placed on schools. People also began to add proposals for change they wanted to see around Springfield. I think that by presenting maps with various resources already highlighted, it was easy for people to see what they didn’t have in their neighborhoods, and in turn, easy to identify and validate the need for more recreation centers, libraries, and other youth programs. Someone even proposed a zoo and a new mall for spaces to gather and hang out with friends. One person did annotate the maps by circling parks that they felt needed clean-up, even telling me that they had personally cleaned up the park once and emailed and called the city about getting a trash can. Someone wrote SOS next to a park, too.
Another person added a star to the map to represent therapeutic places, or places of mental health awareness. We had a conversation about places that encouraged healthy stress management and coping with mental health problems. They told me about how communities of color in Springfield don’t have easy access to places of relaxing and unwinding that would help with their mental health concerns. They like to manage their stress through exercise and going to the gym or going outside, but we also talked about how some people don’t feel safe when exercising outside and saw safe therapeutic spaces as a need for their community. This comment was echoed in some parents’ remembering their childhood experience in Springfield– they wanted to see more youth programs in their area specifically because they felt uncomfortable letting their kids go out to play unsupervised for very long.

All of these conversations generated lots of ideas about how to make Springfield better, what people love, what people want to see more of, and what people need. The act of mapping, I hope, creates a sense of worthiness and credibility– this comes from understanding maps as truth documents. The flip-side of this, of course, is finding the means to enact these proposals for change and can cause frustration if they don’t become a reality. I want to find better ways to have these conversations with people while being completely honest about where mapping stops and acting begins.
Two or three young people stayed at the mapping corner for almost the entire event. We located all the schools they attend and quickly the maps turned into a story– they took visioning and dreaming to a whole new level! One person created an entire story-line about someone escaping beavers and sharks in the Connecticut River and their trials and tribulations throughout their adventure in Springfield. We used the scale to figure out their character swam more than two miles up the river! Though these mappings weren’t “on topic” or working with the original intent of the activity, we still had great conversations about place and what it would be like to make the maps for books.
So what’s next? I want to work on helping steer young people with such vibrant imaginations into the activity better. Right now the way I have this workshop set-up is geared more towards older kids and adults. I noticed that I wasn’t able to explain the activity quick enough to help people get the most out of the maps. Since it was an open drop-in event, I let people interpret as they see fit and kept the guidelines as loose as possible, however, that may have been more confusing to some. I need to create more succinct directions without locking participants into only one way of seeing and using the maps. Having the written questions on a poster didn’t seem to help– perhaps they were often hidden by the maps themselves, but most people didn’t know what to do even when reading the guiding questions I prepared. Some also noted that they couldn’t see the details of the maps well– perhaps I will bring a magnifying glasses or reading classes next time! Lots of ways to improve for the next workshop. If you have any ideas, please contact Emma Harnisch (eharnisch@smith.edu).


