With the fall semester halfway over, things have been pretty hectic in the Spatial Analysis Lab! We are gearing up to provide regular support to two additional Environmental Science and Policy classes in the coming months. Students in a core course in the major, Collecting and Analyzing Information, will be working with GIS data to […]
Tag Archives: Mystery Map
October Mystery Map Solved!
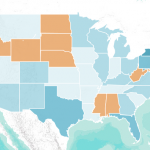
October Mystery Map: “Fifty Nifty United States” What do the eleven orange states have in common? The answer is: There are no students in the Smith College Class of 2016 from any of the orange states (Alabama, Delaware, Hawaii, Idaho, Mississippi, North Dakota, Nebraska, Nevada, South Dakota, West Virginia, and Wyoming). The map below shows […]
New Mystery Map!
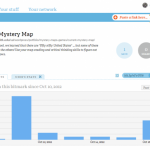
The October Mystery Map is now available! It’s interactive this month, which means you can zoom, pan, and click to get a better sense of the data … and what the map might show. Check it out here and then enter a guess for the chance to win a prize!
October Mystery Map
October Mystery Map: “Fifty Nifty United States” What do the eleven orange states have in common? In elementary school, we learned that there are “fifty nifty United States” … but some of these states are not like the others! Use your map-reading and critical thinking skills to figure out what this map shows. Check out […]
September 2012 Mystery Map Solved
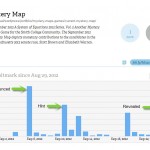
The September 2012 Mystery Map depicts monetary contributions to the candidates in the Massachusetts 2012 senate race, Scott Brown and Elizabeth Warren.
April 2012 Mystery Map Solved
The Answer is The April 2012 Mystery Map reveals monetary contributions to David Narkewicz and Michael Bardsley during the 2011 Northampton Mayoral Campaign. The points are located at the contributor’s address and sized proportionally to indicate the amount of contribution. Each point is color coded by candidate: Narkewicz is light green, Bardsley darker green. And, the winner […]
Cartograms
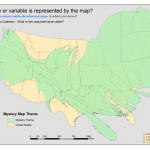
A cartogram is a thematic map in which some variable (e.g. population) is substituted for land area. The alternate variable is conveyed through a distorted geometry of the map. This example displays the state origins of the Smith Class of 2012. December 2008 Mystery Map displaying class of 2012 as a cartogram View as a […]
