 How easily will farmers adapt to anthropogenic climate change? Will the losses from climate change be severe or more moderate? Economics professor Vis Taraz’s project seeks to answer these questions in the context of Indian agriculture. She will exploit the fact that the Indian monsoon undergoes multi-decadal wet and dry regimes. During a wet regime, total rainfall for India for that decade tends to be above its historical average, and conversely for dry regimes. Furthermore, there is regional variation in the monsoon regimes – so that while part of a country is in a wet regime, another part will be in a dry regime.
Vis analyzed the extent to which farmers detect and adapt to these decadal variations, by looking at how irrigation and crop choice decisions respond to the monsoon regimes. She found that farmers do indeed adapt to the rainfall variations, but that the magnitude of these adaptations is limited. In particular, farmers are able to recoup only 15% of their losses due the monsoon regimes. This is suggestive that barriers may exist that will hinder farmer’s abilities to adapt to future anthropogenic climate change.
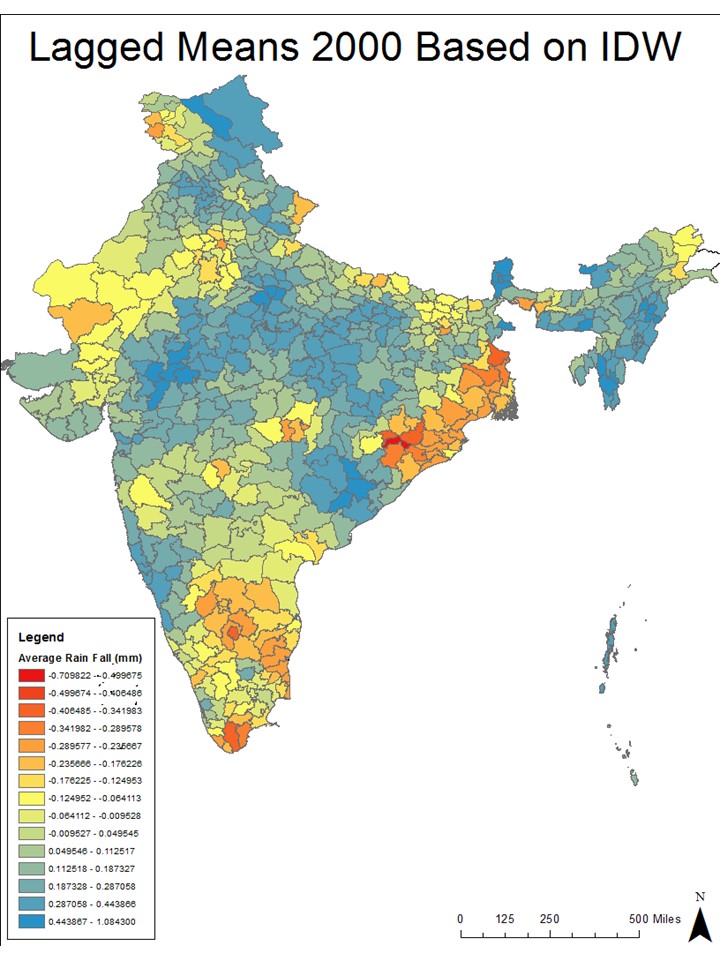
For this project, Vis needed to use GIS to generate detailed maps of India that displayed the monsoon regimes – both their variation over time and their variation over space. She created data files that indicated the previous decade rainfall for each latitude and longitude grid point, for 4 different snap shots in time (1955, 1970, 1985, 2000). Victoria, SAL’s Spatial Fellow, then took these underlying data sets to create maps that indicated, with color shading, what the rainfall in each district had been over the past decade.