GEO150 Modeling Our World: Introduction to GIS
Our flagship GIS class at Smith.
From the course catalog:
Same as ENV 150. A geographic information system (GIS) manages location-based (spatial) information and provides the tools to display and analyze it. GIS provides the capabilities to link databases and maps and to overlay, query, and visualize those databases in order to analyze and solve problems in many diverse fields. This course provides an introduction to the fundamental elements of GIS and connects course activities to GIS applications in landscape architecture, urban and regional planning, archeology, flood management, sociology, coastal studies, environmental health, oceanography, economics, disaster management, cultural anthropology, and art history. Enrollment limited to 20.
- Fall 2013
- Fall 2012
- Spring 2011 final maps
- Schedule and Topics
- Video Tutorials (from 2007 & 2009)
- Spring 2009 final maps
- Spring 2007 final maps
This semester, the GIS content (tools, techniques, and skills for working with ArcMap, ArcCatalog, and ArcToolbox) of Smith’s Intro GIS course is nearly identical to previous semesters. However, much of the data has changed to be local! Students are asking the same spatial questions as before, but they are turning their GIS lens to Smith College, Northampton, and Massachusetts instead of unknown geographies. In addition, students took the Trimble Junos outside and completed a GPS data collection activity, which had previously not been part of the curriculum.
Fall 2013 Topics:
- Getting to know ArcGIS, ArcCatalog, and ArcToolbox
- Coordinate systems, datums, and projections
- Spatial Data: raster vs. vector, georeferencing, digitizing features, collecting GPS data
- Symbology and map layouts
- Working with tables, joining, and downloading & using census data
- Geodatabases and editing features
- Spatial analysis techniques using vector data
- Spatial analysis techniques using raster data
• What Is GIS?
• Getting Acquainted with ArcMap
• Getting Acquainted with ArcCatalog and ArcToolbox
• Presentation: Coordinate systems, datums and map projections
• Reading: Figure of the Earth
• Exercise: Coordinate Systems, Datums and Map Projections I
• Exercise: Coordinate Systems, Datums and Map Projections II
• Presentation: Nature of spatial data
• Exercise: Working with Vector and Raster Data
• Exercise: Acquiring Spatial Data
• Presentation: Symbolization
• Exercise: Creating Symbology
• Exercise: Working with Map Layouts
• ArcMap Cartographic Tools
• Presentation: Cartographic principles
• Presentation: Working with Tables and Census Data
• Summary File 3
• Exercise: Working with Tables
• Exercise: Working with the U.S. Census I
• Project Documentsfile
• Exercise: Working with the U.S. Census II
• Presentation: Basic spatial analysis
• Exercise: Analyzing Features I
• Exercise: Analyzing Features II
• Presentation: Raster Analysis
• Exercise: Raster Analysis I
• Reading Assignment: Harvard project examplesfile
• Assignment: Raster analysis II
• Advanced Analysis
• Spatial Statistics Primer
• Crime Analysis
Final Projects 11 April – 1 May
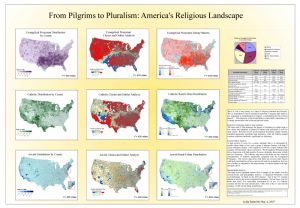
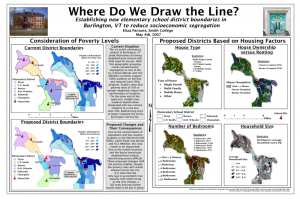
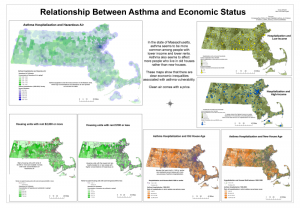
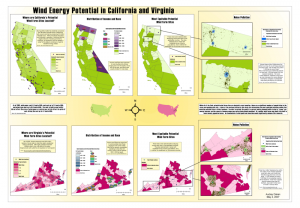
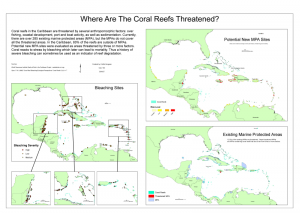
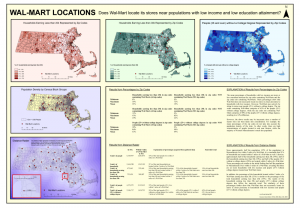
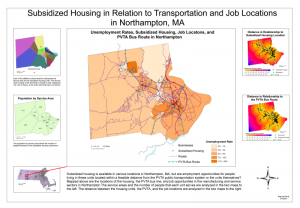
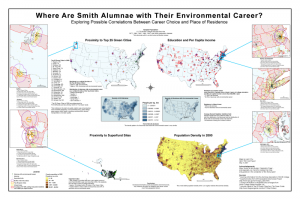
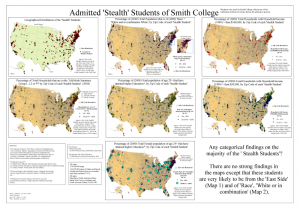
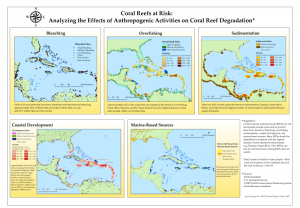
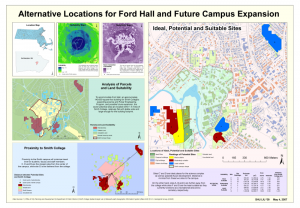
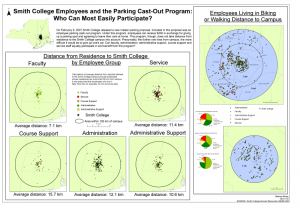
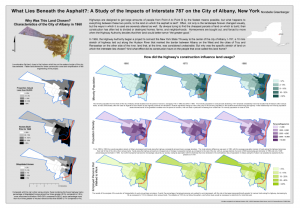
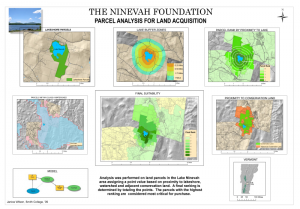
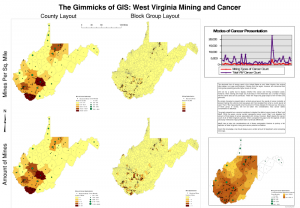
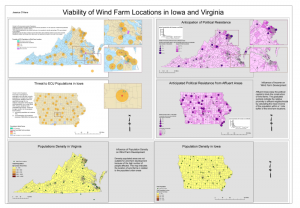
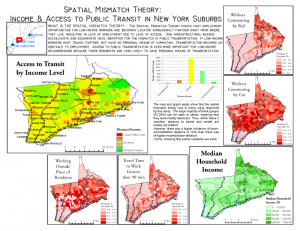
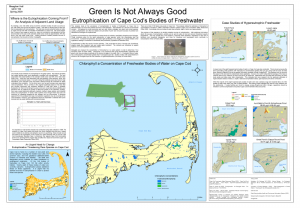
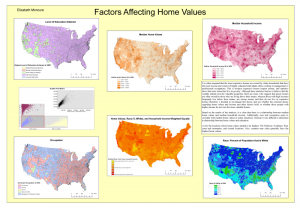
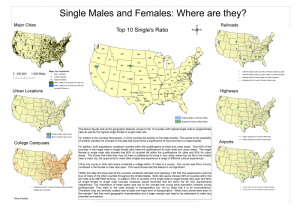
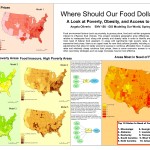
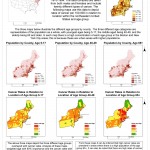
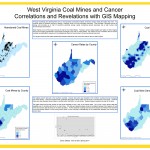
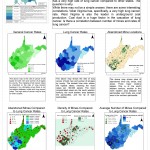
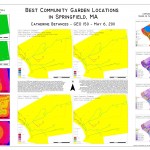
A Sampling of the 2007 Final Maps from GEO150
Note: click on one map to launch image viewer and then use arrow keys to cycle through the set. Higher resolution images available on request.
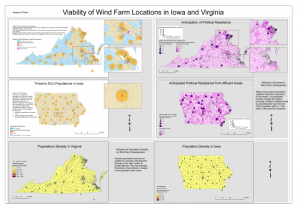
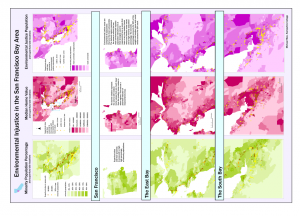
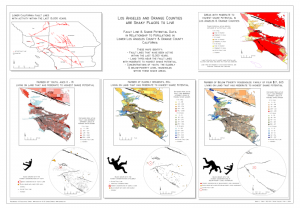
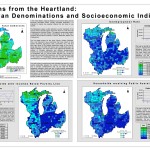
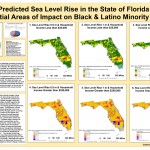
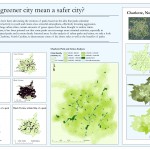
A Sampling of the 2009 Final Maps from GEO150
Note: click on one map to launch image viewer and then use arrow keys to cycle through the set. Higher resolution images available on request.
Watch Sea Level Rise 2.2 Meters in NYC!
map and data by Jeannette Quinn, AC ’09 (opens in new window)
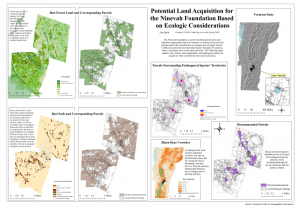
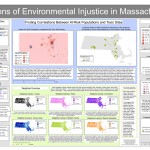
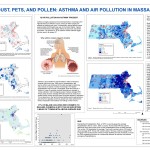
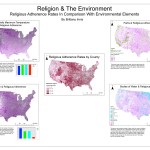
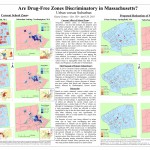
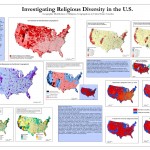
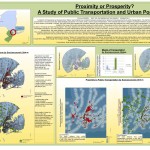
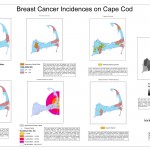
A Sampling of the 2011 Final Maps from GEO150
