Fall 2017 (Lello)
Spring 2016 (Washington-Ottombre) – 22 students
Fall 2015 (Barron) – 13 students
Spring 2015 (Washington-Ottombre) – 12 students
Fall 2014 (Stein) – 5 students
Spring 2014 (Stein)
Fall 2013 ~ 5 Students (Busa)
Spring 2013 ~ 22 Students (Stein)
Fall 2012~ 16 Students (Busa)
Fall 2011 ~ 16 Students (Busa)
From the course catalog:
While focusing on three environmental topics, students will learn how to gather, analyze and present data using methods from the natural and social sciences. Data will be drawn from multiple sources, including laboratory experiments, fieldwork, archival sources, surveys, and interviews. Emphasis will be on quantitative analysis. Environmental topics will vary in scale from the local to the global. This course includes a required laboratory section. Prerequisite: one semester of statistics. ENV 101 is recommended. Enrollment limited to 18. (E) Q
Spring 2016
We started off the semester by learning GPS with a GPS scavenger hunt around campus. Students then used their GPS skills to analyze the microclimates of MacLeish Field Station. In the first GIS lab, students learned about the principles of cartographic design while analyzing the connection between demographics and environmental risk in Northampton. In the second lab, the students analyzed Smith’s vulnerability to high-precipitation events and suggested ways we could make the campus more permeable to reduce the annual utility fee imposed by the City of Northampton.
Fall 2015
Students analyzed environmental justice data from the EPA’s EJScreen project, looking at exposure to lead and toxic emissions in Holyoke, MA. Many incorporated GIS and GPS into final projects on lead contamination in urban farms in Springfield and soil permeability on campus.
Fall 2011, 2012, 2013
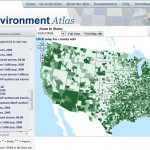
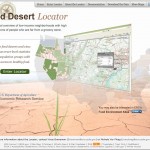
Food Desert Interactive Maps:
- USDA Food Environment Atlas: http://www.ers.usda.gov/data-products/food-environment-atlas/go-to-the-atlas.aspx#.UmrR3fmKLAk
- USDA Food Access Research AtlasL http://www.ers.usda.gov/data-products/food-access-research-atlas/go-to-the-atlas.aspx#.UmrAWfmKLAl
- ESRI Food Desert Finder: http://megacity.esri.com/fooddeserts/#-10570450.2925;4722931.8985;10
- Another version of the same map: http://www.arcgis.com/explorer/?open=153c17de00914039bb28f6f6efe6d322
- Social Explorer: http://www.socialexplorer.com/89AACD3A4F1E4E1/explore
Things to think about while exploring the maps:
- How are the creators of this map defining a “food desert”? What spatial data are they including in their criteria?
- Is the map itself a useful way to analyze or communicate about food deserts? What scale of data is available (state, county, census tract)? Are the colors and/or the legend easy to interpret?
Food ~ Farming ~ Food Deserts ~ Food Capacity
Links
Climate Change
Links
Maplecroft’s Climate Change and Environment Risk Atlas- Climate Change Map
Lab Assistants – 2011 – 2012
Naomi:
Tues 11/8 7:00-8:30pm (regular time)
Wed 11/9 7:30-8:30pm
Thurs 11/10 9:00-10:20am
Mon 11/14 10:00-10:50am (regular time)
(not Wed that week)
Thurs 12/1 9-10:20am
Mon 12/5 10:00-10:50am (regular time)
Tues 12/6 7:00-8:30pm (regular time)
Camille:
Wednesday: After 3:30PM
Thursday: 4PM to 6PM and after 9:30PM
Friday: 12PM to 2:30PM
Spring 2103 and Spring 2014

