Accessibility of Family Services in the Flats of Holyoke, MA

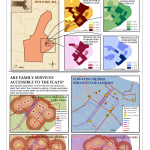
María J. Rendón GEO150, spring 2007 THE RECOVERY OF HOLYOKE THROUGH FAMILY-ORIENTED SERVICES Holyoke is notoriously known to be the poorest city in the state of Massachusetts. Its high poverty levels are intrinsically tied to a variety of problems among the youth, such as high drop-out rates, crime and substance abuse, teenage pregnancy, etc. In […]

Smith Alumnae

Download the Google Earth file and explore: Spatial Mean (kmz)  

Data Classification

Simple changes in data classification alter the patterns and display of a map. Examples of mapping 1990 US Population Density.  

Illustrating the Invisible

The purpose of this study was to examine the relationship between Smith College students and the Smith College campus through a spatial medium

Community Divided?

Mapping the comfortable margin of the Northampton Proposition 2 1/2 override tells a different story…

2008 Presidential Campaign Contributions

The “background” portion of the map represents total campaign contributions per Massachsuetts town. This type of map is referred to as a Choropleth Map in which areas are shaded based upon a particular theme or value. In this case, our theme is total campaign contributions. By convention it is best to represent a rate or […]

Northridge Earthquake

This example demonstrates display of space and time events.  Data were developed and animated in ESRI’s ArcGIS software and exported to a QuickTime movie format. Northridge Animation (Quicktime Movie showing number of aftershocks by time and location)               Originally developed for a textbook on GIS and Natural Disasters.