By SAL Assistant Kalynn Kosyka ’19
The goal of the project was to map social media data to look for interesting geographic patterns. We originally wanted to use data from Instagram, but, unfortunately, Instagram changed their restriction policy last summer making it difficult to obtain the data we wanted. However, we were able to access Twitter through their API. After registering for access to the API, I searched for potential Open Source code as I would build off it since it would be more efficient.
Once the access codes worked, I was able to start gathering data based on a specific hashtag, allowing us to get a lot of information about each tweet. Since this map project is under the direction of the Spatial Analysis Lab, tweets with geographic coordinates were required. We decided to parse the information, leaving us with: text of tweet, latitude, longitude, screen name, details of the creation of the tweet, and the list of hashtags used for the tweet.
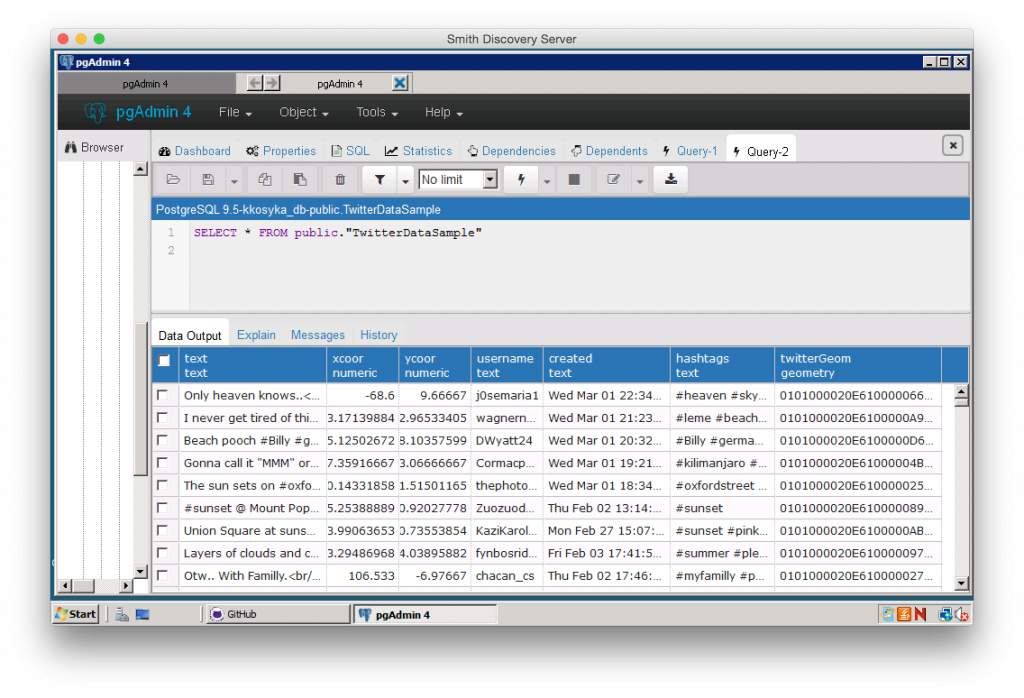
Twitter data stored in a PostgreSQL database
After parsing the twitter data, I created a timer that allowed the code to run for days, grabbing data every hour and appending the information into a *.csv file. Later, the parsed data were migrated to a PostgreSQL database on the SAL’s server via pgAdmin. With the database connection working, I was able to convert the coordinates into GeoJSON coordinates with specified a spatial reference identifier (SRID – 4326, which means the coordinates are in latitude and longitude). This allowed me to use GeoServer and the web-mapping Javascript library Leaflet in order to display a world map with tweet pins.
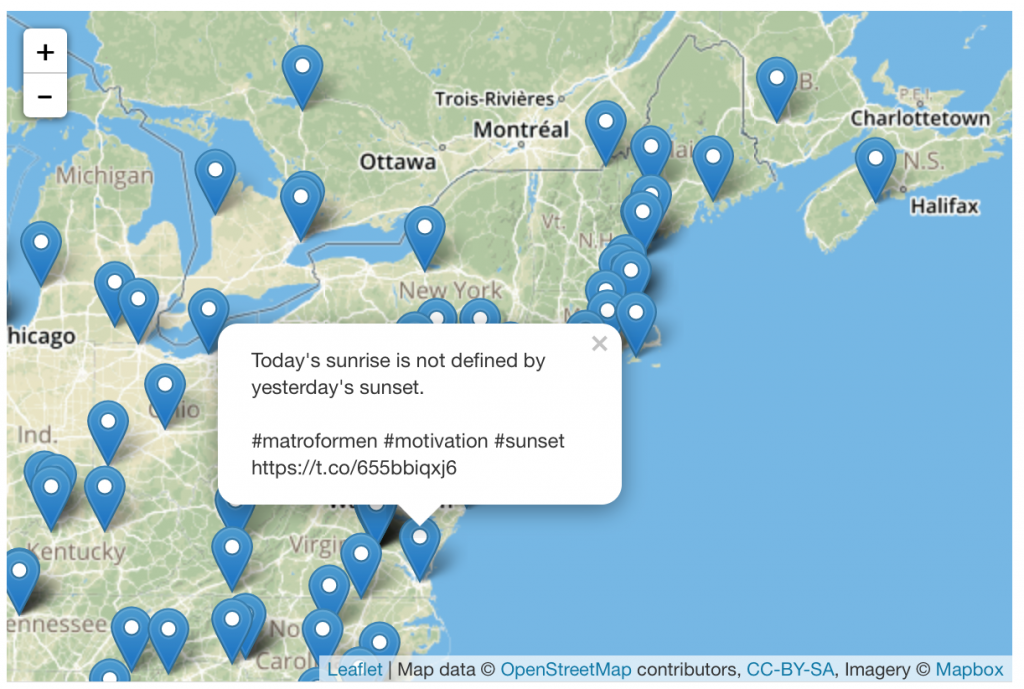
Tweets about sunsets mapped using Leaflet.js. We hope to make the final map publicly accessible soon!