For four weeks during July and August, the SAL was abuzz with activity as dozens of high-school students designed web maps on topics ranging from local geology to bird migrations in East Asia. We worked with three different classes in the high school summer programs this year: Anne Wibiralske’s Field Studies in Sustainability class, Ethan Myers’s Science and Nature Writing class, and Denise Lello’s Story-Mapping Energy class.
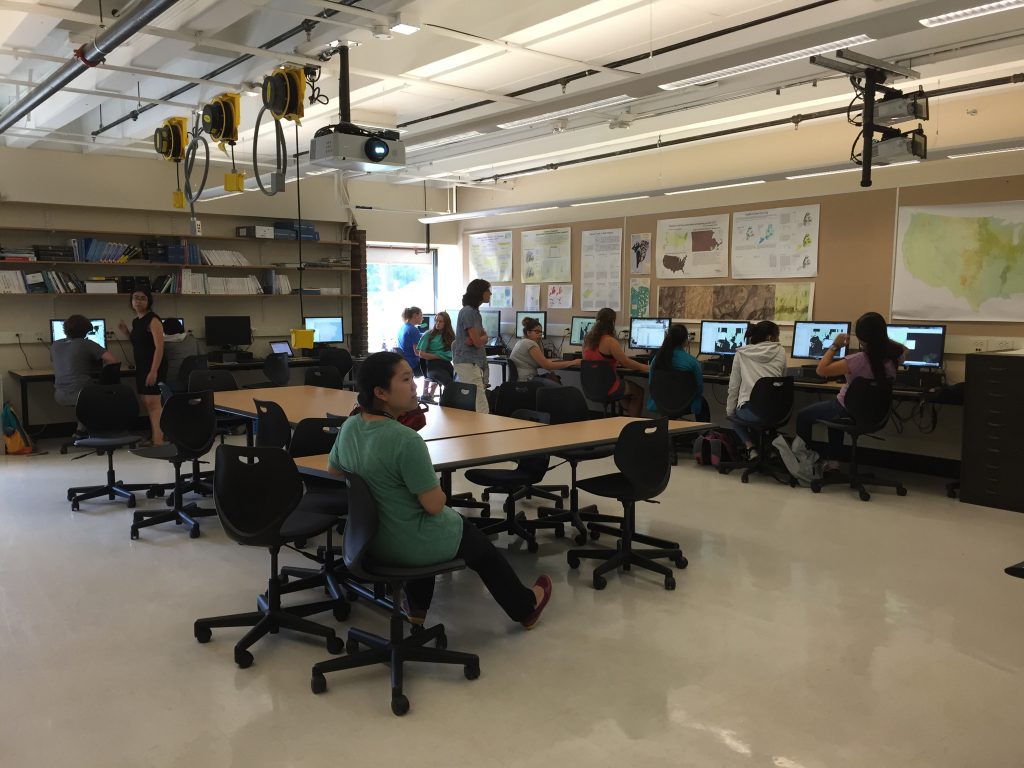
Students in Denise Lello’s Story-mapping Energy class are hard at work designing their final story maps.
In Field Studies, we introduced students to ArcGIS Online in one of their first sessions. We provided them with spatial data about Western Massachusetts, such as bedrock geology, land use, and plant hardiness zones. The class then went on several field trips to learn about the area’s natural environment and local efforts to achieve sustainability, taking a GPS unit with them. When they returned, we added their GPS points to the map to contextualize the sights they saw with the data that we presented on their first day in the lab. The students then used ArcGIS Online to investigate sustainability in their hometowns before the course wrapped up.
Students in Science and Nature writing may have been slightly confused the first time they visited the SAL – after all, what business does a writing class have making maps? We hope, though, that the students realized the power of maps as narrative devices after an introduction to Esri’s Story Maps platform. Based on their final Story Maps, it sure seems like they did: they collectively made a Story Map exploring the themes of forests, floods, transience, and return in the natural and human history of the Pioneer Valley. You can check out their work by clicking on the image below.
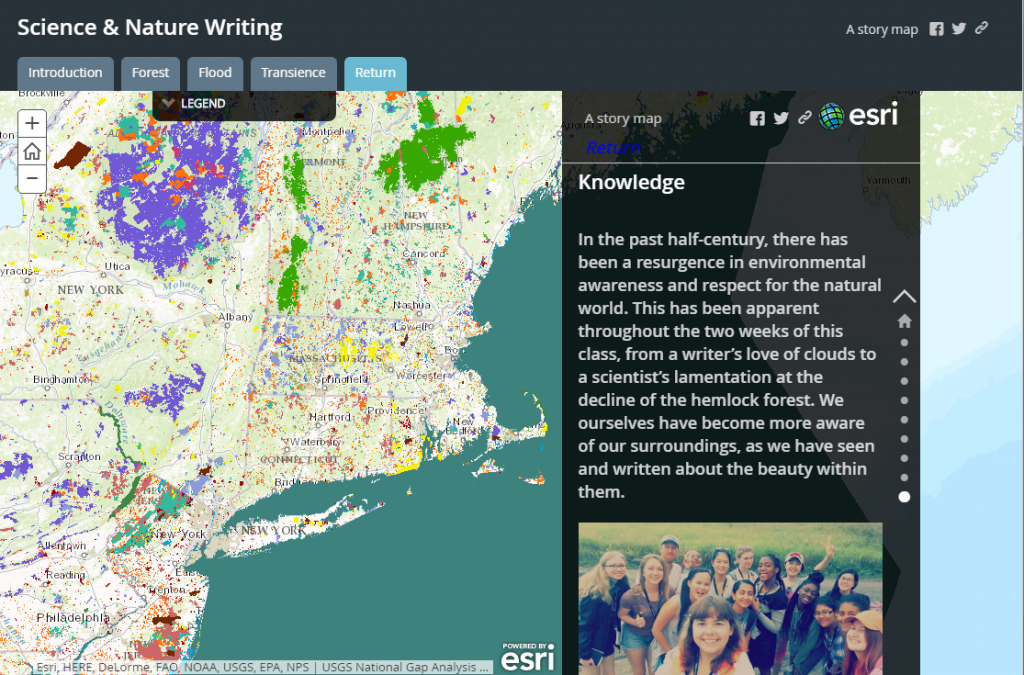
Click on the image to see the Story Map created by Ethan Myers class, Science and Nature Writing.
Story Maps also played a big role in the Story-Mapping Energy class, as the name implies. Before getting to Story Maps, we spent a week analyzing data such as land cover, average surface temperature, precipitation, net primary productivity, and soil fertility to trace the global path that energy takes in the form of carbon and water molecules. The students then examined human energy usage and how it connects to energy within ecosystems. Finally, using their newfound knowledge, the students created a Story Map illustrating how the global distribution of energy has impacted the history of life on earth, and how the process will change in the future as humans continue to require more resources than we can sustainably produce. To see their collaborative Story Map, click the image below.
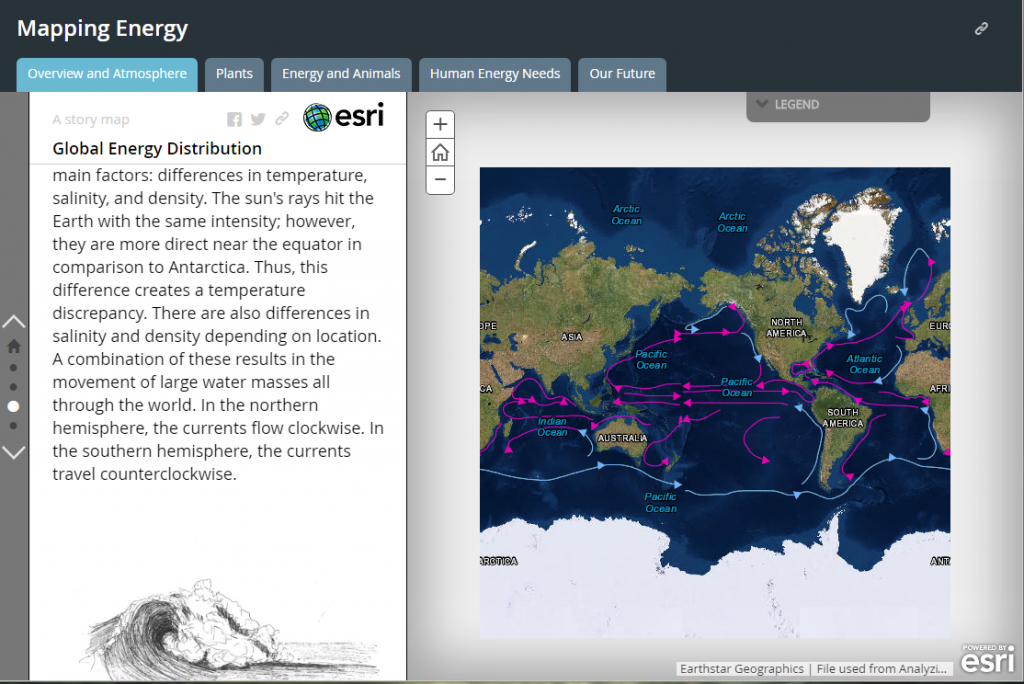
Click on the image above to see the Story Map produced by Denise Lello’s class, Story-Mapping Energy
Seeing the enthusiasm with which these high school students approached Story Maps was truly a rewarding experience for the SAL staff. We hope that their experience in the SAL inspired them to consider maps more critically and maybe even design more maps of their own.