The answer is:
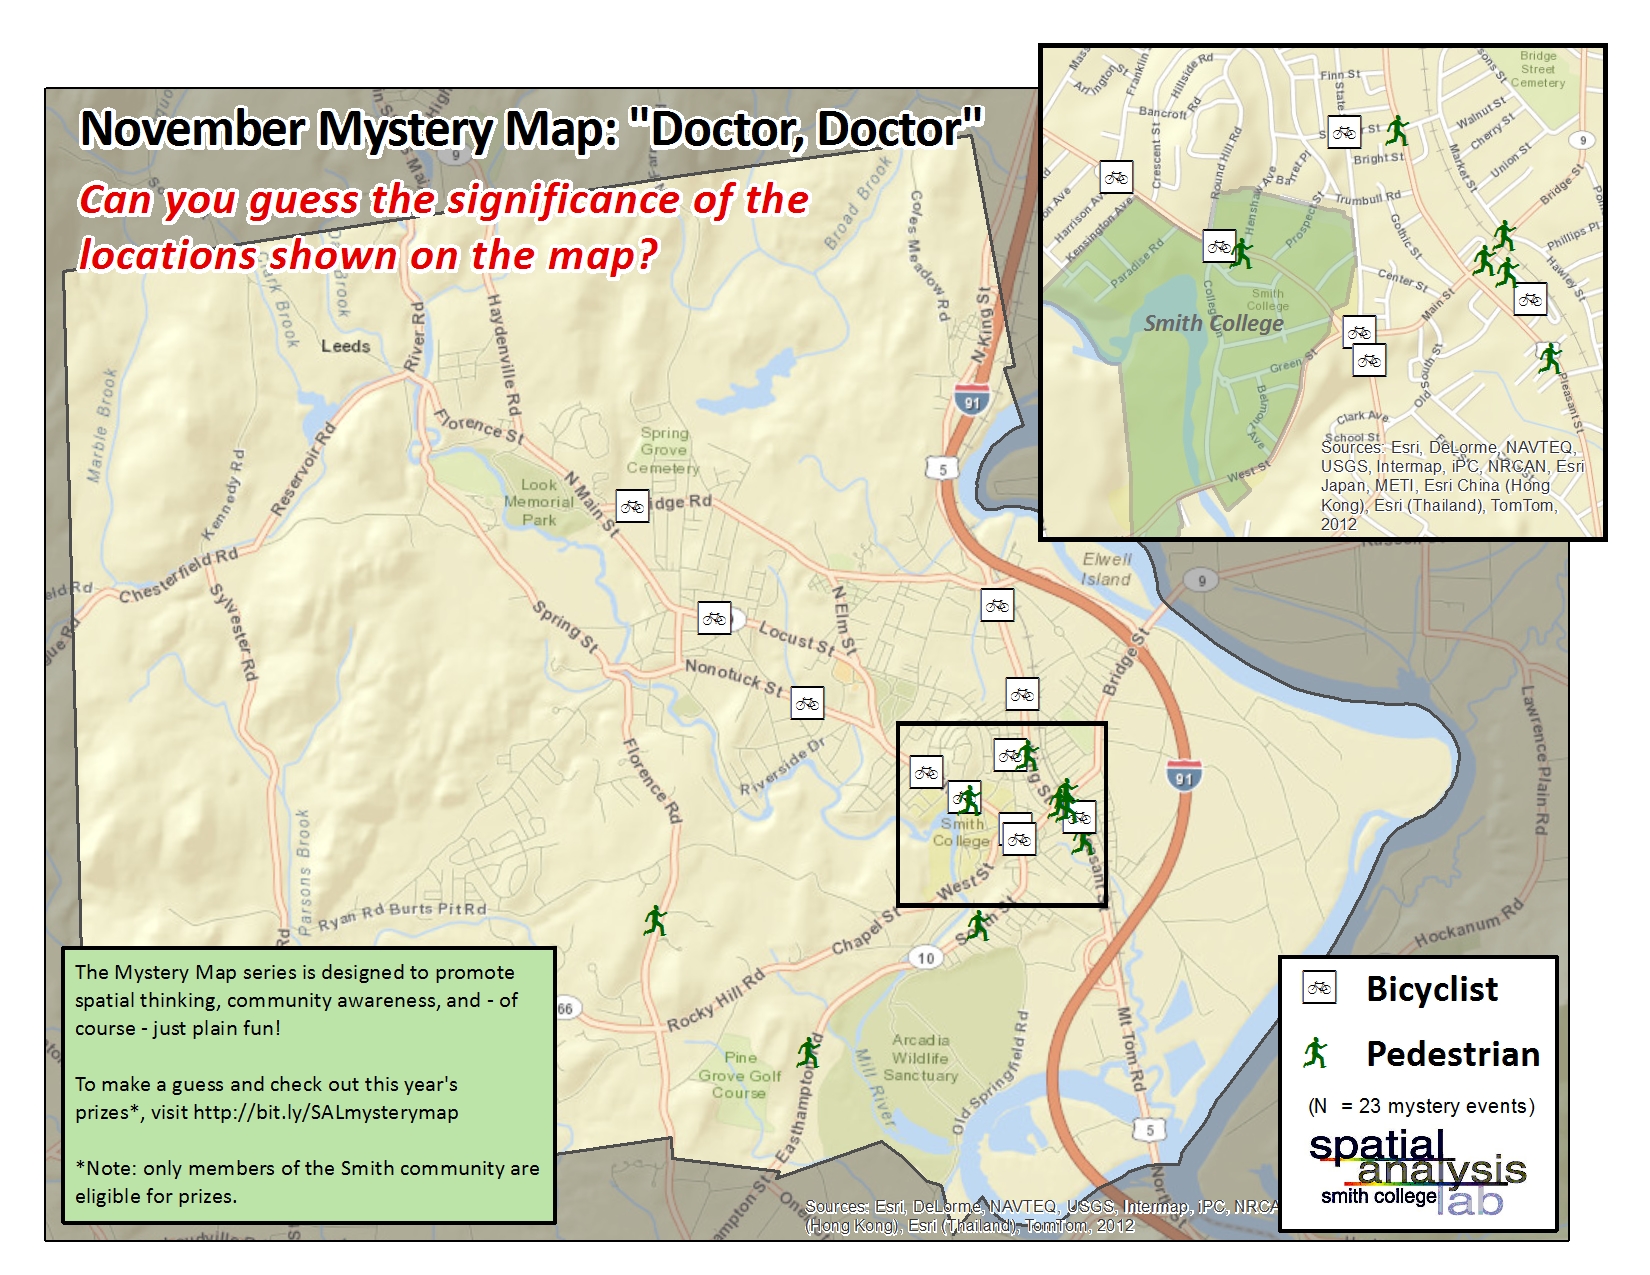 The November Mystery Map showed the locations that non-motorists (pedestrians, bicyclists, etc) have been hit by cars in downtown Northampton. In this case, the data is from the year 2010, showing a complete snapshot of collisions during that year. In 2010, there were 23 reported collisions between motor vehicles and non-motorists, and according to local news, that number is growing all the time: there have been discussions of removing or reworking some of the more dangerous crosswalks, and many concerned citizens are advocating for better safety measures to protect pedestrians in Northampton’s walking-friendly downtown. As the map shows, some of these accidents happened on or near the Smith campus, so consider this your friendly parent-like warning to look both ways before crossing the street 🙂 and be especially careful on Old South Street and New South Street!
The winner is:
Though many of you submitted very close guesses, no one got this map entirely right. Some partially correct answers included: places where pedestrians have been hit by cars, places where traffic accidents have occurred, and places where ambulance calls have been made. All of these inferences, and many others submitted, show good spatial awareness and map-reading skills. I think this one is on us: when making mystery maps, we try to use visual clues that suggest the Mystery Variable– just as most cartographers use cultural associations with color, line, and symbol to make maps visually accessible and easy to figure out. By using one symbol (the red circle with an X, showing danger) to map two different things (vehicle crashes with both pedestrians and bicyclists), we made this map too confusing. A cartographic crime! We apologize, and we will do better in the coming map animation (!) for December, so check back soon.
The Making of the Mystery Map:
As the hint indicated, this Mystery Map was prompted by the fact that two serious accidents involving pedestrians happened in downtown Northampton within a relatively short time span– one on Oct. 31, and the other on Nov. 4. These collisions brought a lot of attention to traffic patterns and pedestrian safety in Northampton, as reflected through numerous articles and letters to the editor in the Hampshire Gazette.
Well, here at Mystery Map headquarters, when we hear about spatial phenomena like traffic patterns and hotspots of pedestrian incidents, we immediately think: “This could be better understood with a map.” Serendipitously, at the Spatial Analysis Lab we had just created a robust data set of all the traffic accidents in Hampshire Country, based on this article and map from a September edition of the Gazette, with the help of one of the awesome student staff members of the SAL, Camille. We used the “spatial filtering” capabilities of GIS software to narrow down all of the Massachusetts Department of Transportation crash records to just those that took place in Northampton, and just those that involved non-motorists. And the Mystery Map was made!
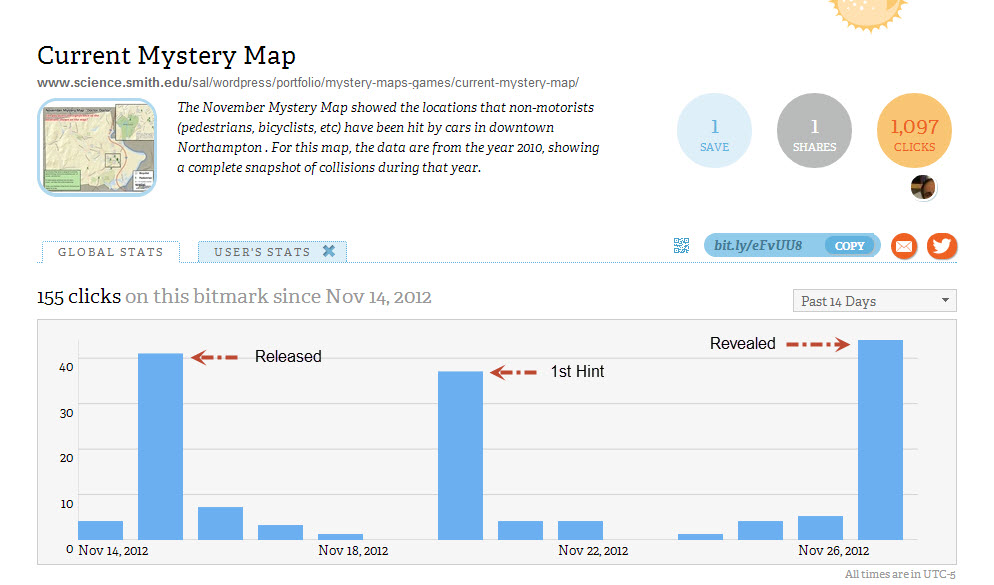
Mystery Map Stats for the Month of November
How many competitors dared look at this month’s challenge?