By: Tingshan, Jessica, and Amalia
The CDC characterized last year’s flu as having “extremely high hospitalization rates” for both children and older adults (1). To keep that number from climbing many citizens opt to get vaccinated against the unforgiving grip of this seemingly benign disease. There are 319 million disease carrying vectors in the United States and if you are one of the 29 million without health insurance, the prospects of getting this disease are terrifying (2). Unfortunately, getting health insurance isn’t a walk in the park either. In 2015, 43 million people were below the poverty line in the United States (3). Obamacare can be up to $800 a month, which can be more almost 50% of the monthly income of many Americans (4). Unless our capitalist government revises its regime, that heart wrenching number of people without health insurance will likely only ascend.
Particular strains are more deadly than others. The CDC reports that, “Seasons during which influenza A (H3N2) viruses predominate typically have higher rates of hospitalizations and more deaths, particularly among older people and children (5).” So, let’s say that last year there was an outbreak of H3N2. Now, this year there’s rumor of a strain very closely related to H3N2 that is mercilessly sweeping the nation, deemed H3llN0. It would be ideal to use the data collected from the H3N2 infection that took place during the past season and apply it to form a hypothesized SIR model for the incoming H3llN0 mutated strain.
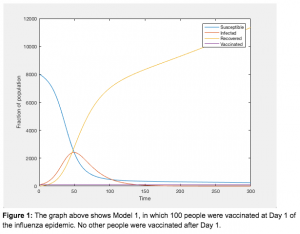
Our models are based off of this idea, we began with “model 1,” or the model with a constant population of people who receive vaccinations. We included this model in the series for the sake of comparison, and the recovery rate is linearly dependent on the vaccination population (Figure 1).
The next model called “model 2,” has useful data gathered from the past hypothetical H3N2 outbreak, with the infection rate proportional to the rate of vaccination (Figure 2). We focused on the infection rate from last year’s H3N2 outbreak 14 days after the initial infection because Day 14 of model 2 reflects a period of time where the infection rate was comparatively higher than it was at the beginning of the epidemic. So, to predict the H3llN0 upcoming outbreak, in model 4, the rate of vaccination on day one is proportional to the rate of infection during day 14 of model 2 (Figure 2). Starting the vaccination rate of model 4 at that point ensures that the projected estimate of the amount of people who should receive vaccinations would be more than sufficient. To reiterate, the estimate of people who should receive vaccinations on each day in the upcoming outbreak is based off of the number of those infected 14 days later from a similar epidemic that took place in the past. Model 3 (Figure 2) is based on the same premise as model 4; however the vaccination rate on day one is proportional to the rate of the infected population on day seven of model 2. In Figure 2, we used a vaccination rate of 1%, which means that 1% of the infected population would get vaccinated per day. This rate was arbitrarily assigned and when it was used it demonstrated the hypothesized results– a decrease in the number of people within the infected population.
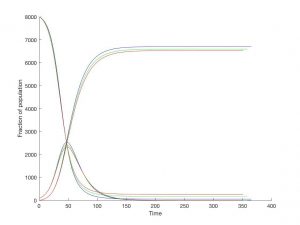
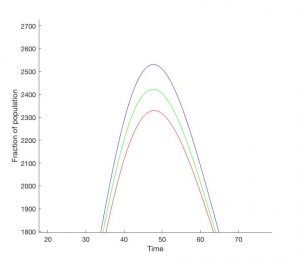
Figure 2: Models 2-4 using a vaccination rate of 0.01 or 1% of the infected population. (A) This shows Models 2-4 within one graph (Model 2 in blue, Model 3 in green, and Model 4 in red). (B) An enlarged image of the peak of infection during the influenza vaccination. For Models 2-4, the peak of infection occurs at Day 48, but they have decreasing numbers of infection, as expected (Model 2- 2521 infected persons, Model 3- 2423 infected persons, Model 4 – 2330 infected persons). These models were generated using MATLAB Software.
The goal of this series of models was to see the impact of the prediction time on the rate of infection. Prediction time, in the case of our model series, refers to the selected timeframes of each model. In all models, the peak of the epidemic occurs approximately at the same point in time. The result of the models was that the longer the prediction time, the lower the infected population. In the third and fourth model, more people were vaccinated than in the second model. This logically makes sense because we increased the prediction time and consequently the vaccination rate was increased relative to the second model. We want to be cautious to not be overzealous with our results. We expect there to be a non-linear relationship between the prediction time and vaccination population, however we remain unable to definitively conclude that statement because the results gathered from this model series are highly population dependent.
Works Cited
Davlin, S. L. (2016). Influenza Activity—United States, 2015–16 Season and Composition of the 2016–17 Influenza Vaccine. MMWR. Morbidity and mortality weekly report, 65.
Barnett, J. C. & Vornovitsky. (2015). Health Insurance Coverage in the United States: 2015. United States Census Bureau. Retrieved from http://www.census.gov/library/publications/2016/demo/p60-257.html.
Proctor, B.D., Semega, J.L., Kollar, M.A. (2016). Income and Poverty in the United States:2015. United States Census Bureau. Retrieved from http://www.census.gov/library/publications/2016/demo/p60-256.html.
Vashi, S. & Hernadez, S. How much will you pay for Obamacare? CNN Money. Retrieved from http://money.cnn.com/interactive/news/economy/obamacare-by-the-numbers/.
Appiah, G. D., Blanton, L., D’Mello, T., Kniss, K., Smith, S., Mustaquim, D., … & Bresee, J. (2015). Influenza activity-United States, 2014-15 season and composition of the 2015-16 influenza vaccine. MMWR. Morbidity and mortality weekly report, 64(21), 583-590.
Frequently Asked Flu Questions 2016-2017 Influenza Season. (2016). Centers for Disease Control and Prevention. Retrieved from http://www.cdc.gov/flu/about/season/flu-season-2016-2017.htm
Seasonal Influenza Vaccine Total Doses Distributed. (2016). Centers for Disease Control and Prevention. Retrieved from http://www.cdc.gov/flu/professionals/vaccination/vaccinesupply.htm