
Are you a frequent flyer? Whether for business or for fun, most of us have traveled somewhere internationally at least once in our lives. This increase in international travel completely changes how viruses and diseases spread. Whether you realize it or not, your susceptibility to certain illnesses is greatly affected by your age. These susceptibility differences within age groups can change the entire age distributions within the population of the country you are departing from or arriving at.
How can epidemiologists and researchers use susceptibility data to study changing population distributions within a country? One simple, but highly effective way is to use an SIR model, which places individuals into three different compartments: susceptible, infected, and recovered. Unfortunately, most SIR models make the assumption that age is not relevant, and do not include age differences within their susceptible populations. So, when you hear about an epidemic on the news, how do you know what age groups are being affected by the disease–should you be more concerned about your own susceptibility or your 4 year old child’s? Researchers Sara Y. Del Valle, James M. Hyman, and Nakul Chitins make a case for including age structures in SIR models in their study, “Mathematical Models of Contact Patterns Between Age Groups For Predicting the Spread of Infectious Diseases.” They write, “There are clear age-dependent differences in susceptibility that must be taken into account when developing models that will guide public health policy.”
There are a number of age-specific factors that should be considered when predicting the spread of infectious diseases. Think about it. What is a common fear about walking into a children’s daycare center during the winter? You are almost guaranteed to be exposed to coughs and sniffles. Assortativity, an age-dependent factor in disease spread, implies that people are most often in contact with those of a similar age. Since children under five are still developing mature immune systems and have not been exposed to nearly the same number of viruses as older age groups, they tend to be far more susceptible to colds and flus. Or, a child may be more susceptible to certain infections than their parent because the parent has been exposed to the infection before, which results in residual immunity.

On the other side of the spectrum, according to the CDC, Center for Disease Control, “between 71 percent and 85 percent of seasonal flu-related deaths have occurred in people 65 years and older and between 54 percent and 70 percent of seasonal flu-related hospitalizations have occurred among people in that age group.” One reason aged people are more severely affected by viruses like the flu is because as we age, our immune systems produce fewer naïve T cells. These cells are like empty files in a file cabinet. The more viruses we are exposed to, the more naive T cells are filled up and become memory T cells, which help your body remain resistant against viruses you have already come into contact with.
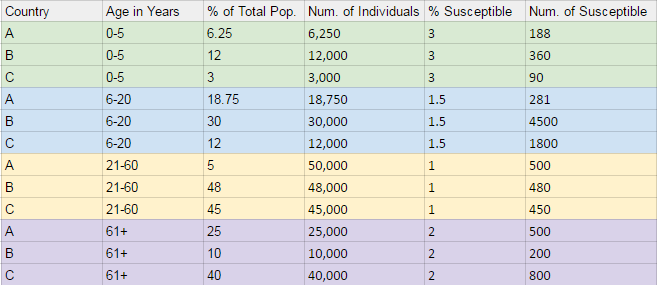
Considering these age-dependent factors influence the dynamics of epidemics, we sought to incorporate them into our SIR model; at the same time we hope to better understand how differences in age-structure susceptibility affect the age distributions of a country’s population. We took a basic SIR model and modified it to account for four age groups. We created three SIR models, each containing four age dependent plots and one age independent plot. Each model uses identical data with the exception of the susceptibility rate and the population distributions outlined below.
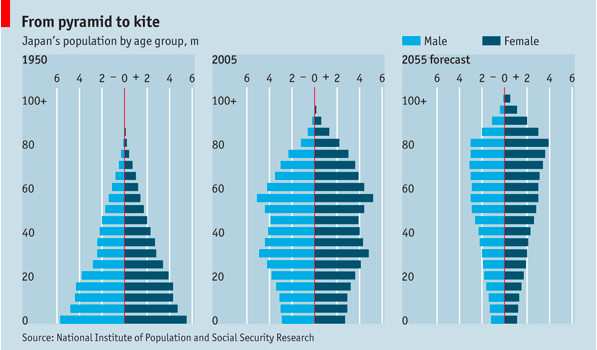
The following assumptions were considered in generating each model: Country A assumes a uniform population distribution (ie. developed country), while Country B assumes a typical pyramid distribution (ie. a developing country) and Country C assumes an inverse pyramid population (ie. similar to what one might see in the E.U.)
Population size: 100,000
The figure below provides an model of what our three population distribution trends resemble:
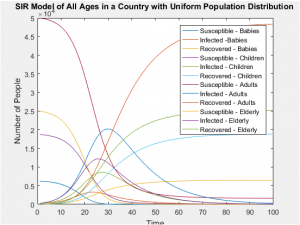
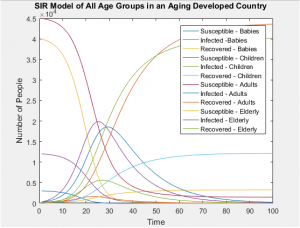
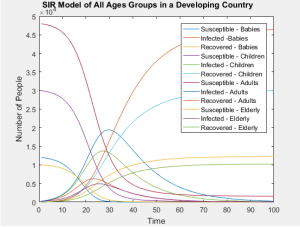
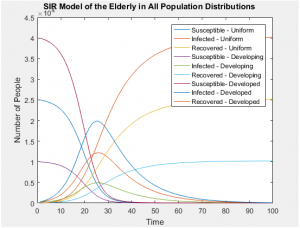
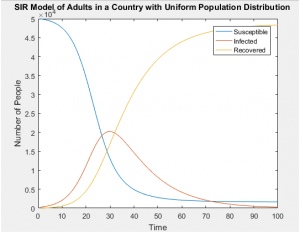
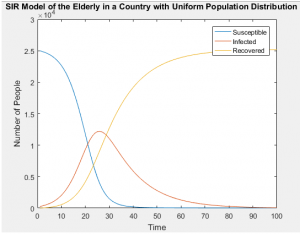
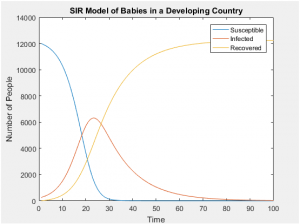
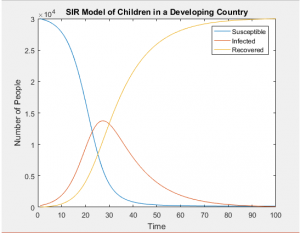
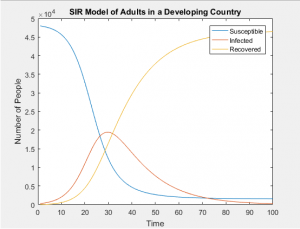
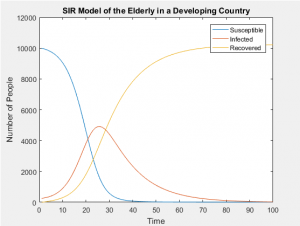
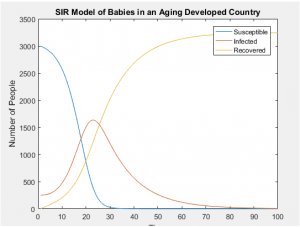
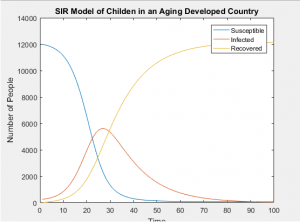
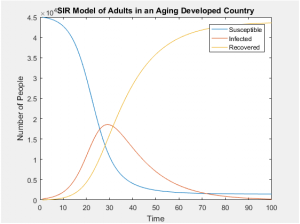
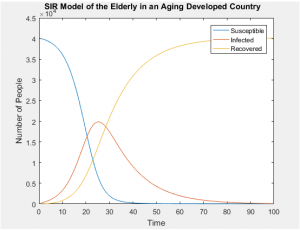
The graphs below show that all age groups in each population distribution vary greatly, affecting the ratio of those susceptible, infected, and recovered far more than the static rates in which each group is infected.
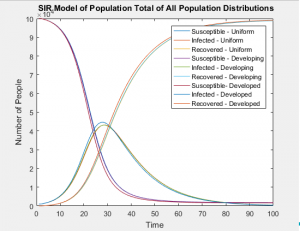
With the same number of people in each of these populations, even when taking into account the differing susceptibilities between populations, the SIR models of the whole population don’t differ in any visually significant way. The population distributions don’t change the number of people infected or the rate of those infections, but they can greatly alter the probability of who will be next. In this case, the answer is clear and intuitive; whichever is the most populous group will most likely contain the next victim of infection.

So watch out baby-boomers!
– Abigail Moore, Sara Van Cor, Tess Abbot
Additional Material:
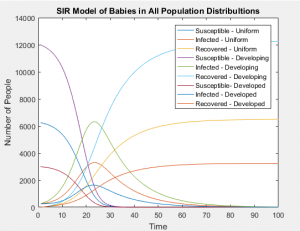
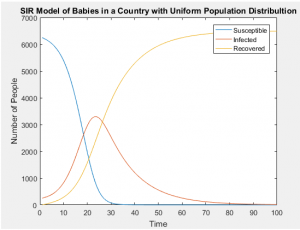
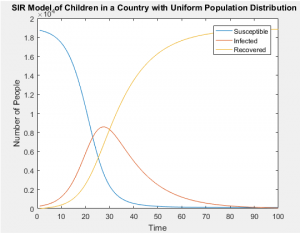
SIR Models of Separate Age Groups in a Uniformly Distributed Population
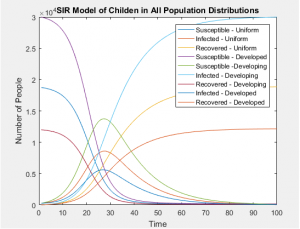
SIR Models of Separate Age Groups in a Developing Population
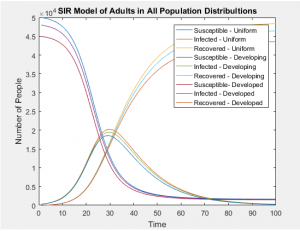
SIR Models of Separate Age Groups in an Developed Population
Sources:
CDC. (2016, August 25). What you should know and do this flu season if you are 65 years and older. Retrieved November 6, 2016, from Influenza(Flu), http:// www.cdc.gov/flu/about/disease/65over.htm
Del Valle SY, Hyman JM, Chitnis N. MATHEMATICAL MODELS OF CONTACT PATTERNS BETWEEN AGE GROUPS FOR PREDICTING THE SPREAD OF INFECTIOUS DISEASES. Mathematical biosciences and engineering : MBE. 2013;10(0):1475-1497.
IMMUNE SYSTEM: Can your immune system still defend you as you age? (2011, December 13). Retrieved November 6, 2016, from National Institute on Aging, https://www.nia.nih.gov/health/publication/biology-aging/immune-system-can-your-immune-system-still-defend-you-you-age
Laskowski, M. (2011). The impact of demographic variables on disease spread: Influenza in remote communities. Scientific Reports, 1, 105.
doi:10.1038/srep00105