By SAL Assistant Rachel Moskowitz ’18
During the fall semester, Professor Liz Klarich came to the Spatial Analysis Lab to ask for assistance with a series of maps for her book manuscript. She requested help with three publication maps detailing her archaeology research in Pukara (Pucará), near Lake Titicaca in the Peruvian Andes. Professor Klarich had been working with maps of the region from a wide range of sources. Some of her maps were created in ArcMap, while others were designed in Photoshop. There was little stylistic consistency across the maps she was using, and some were slightly outdated. Professor Klarich wanted updated and stylistically consistent maps for her new publication.
Professor Klarich asked the Spatial Analysis Lab for help with creating these maps. The maps she requested for her book manuscript included: a regional map of the South-Central Andes, a map of the Titicaca basin with formative archaeological sites, and a zoomed in map of the northern Titicaca basin.
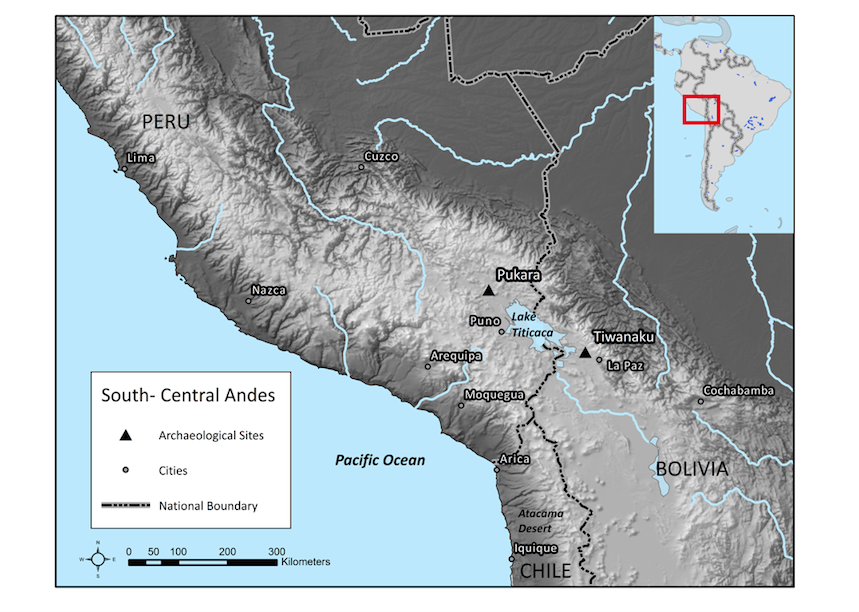
Regional South- Central Andes: Color
In order to create a consistent format for the three maps I created, I downloaded GIS data of the region from Natural Earth Data. The regional data I downloaded includes lakes, rivers, land, ocean, national boundaries, and many other features. After inputting this information in ArcMap, I downloaded DEM data from the USGS EarthExplorer webpage. In ArcMap, I created a hillshade layer out of the DEM data in order to show the detailed topography of the region. The regional data, DEM, and hillshade layers I downloaded and created are used and symbolized consistently throughout the three map products.
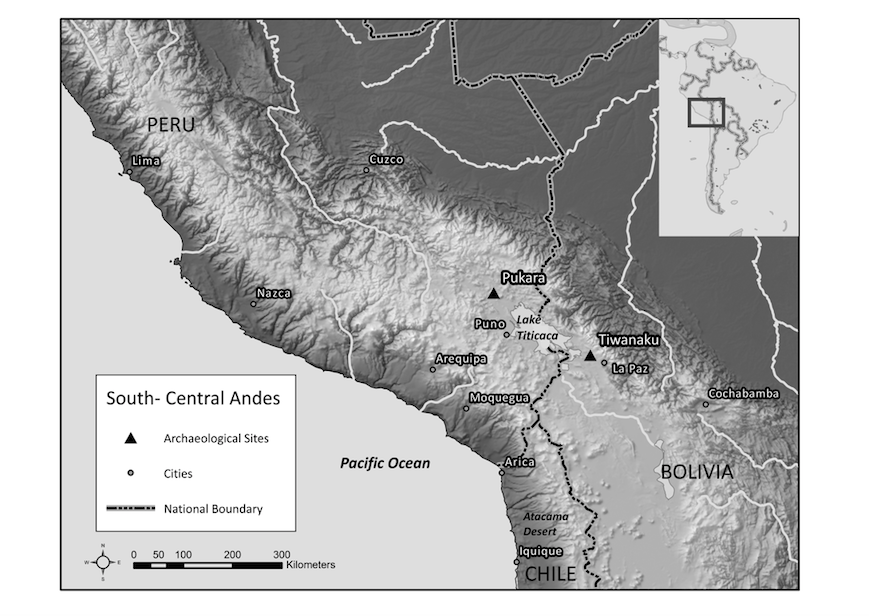
Regional South-Central Andes: Gray-scale
After taking these preliminary steps, I knew that each map I created would have the same base layers. The first map I worked on is the regional map of the South-Central Andes. Professor Klarich wanted to highlight two main archaeological sites, Pukara and Tiwanaku. I first input a layer of relevant cities into my map document in order to create a context for the sites. After, I input the points of the archaeological sites into ArcMap. From here, I formatted the map in order to place emphasis on the sites.
The second map I worked on is a map of the Titicaca basin with formative sites. Professor Klarich and I sifted through an old regional GIS data layer in order to add relevant sites to the map. We georeferenced old maps in order to add relevant sites that were not initially included in the data layer. We edited the layer and added new archaeological sites as points.
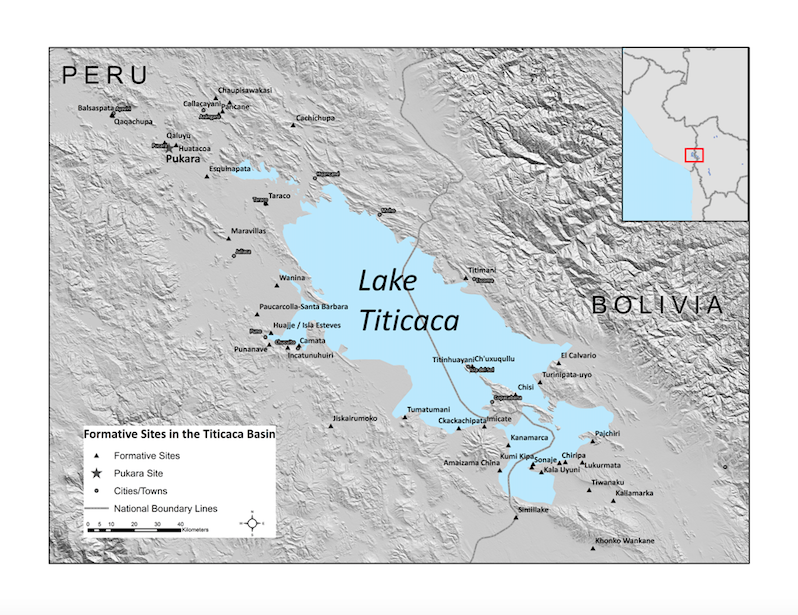
Titicaca Basin: Color

Titicaca Basin: Gray-scale
The third map I worked on is a zoomed in map of the Northern Titicaca basin. Professor Klarich had already worked on creating shapefiles to detail the extent of the survey areas for each site, so I just worked on formatting the document.
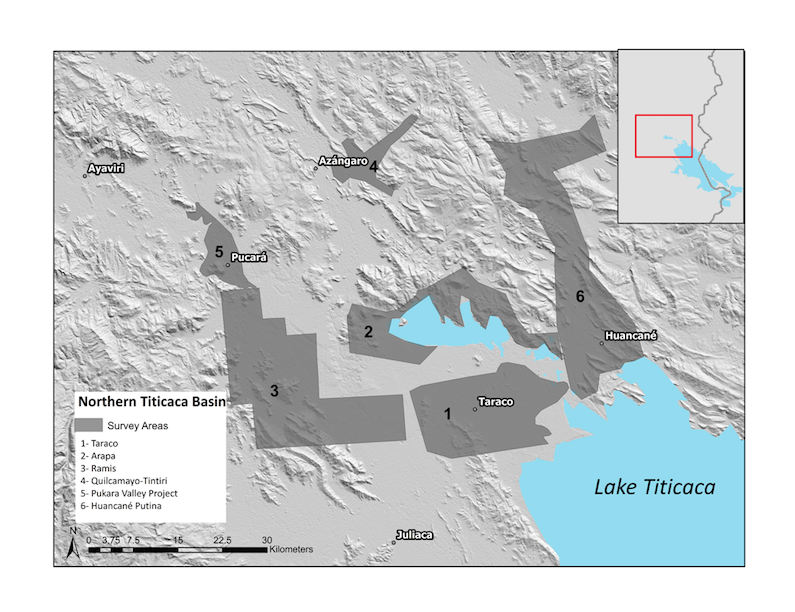
Northern Titicaca Basin: Color
Northern Titicaca Basin: Gray-scale
After I had all of the data located in each map document, I started to learn more about the principles of cartography, and how to make a map ready for publication. I made sure each map was stylistically consistent with the other map documents and exported them in color and black&white for publication. Through this project, I was able to learn more about the principles of cartography, different ways to access spatial data, and how to create a series of maps ready for publication. These maps aim to help readers understand the spatial dimensions of Professor Klarich’s work, and visualize the context of her research.