If you find yourself one afternoon with nothing to do – I know this never actually happens at Smith, but bear with me – I would highly suggest spending a few hours in the SAL, people-watching. At first glance, this may sound like a rather boring activity. Who would want to watch students furiously clicking for hours on end? But if you were in mine or Jon’s shoes, you might understand. The variety of people and perspectives that come through the lab constantly amazes us. Here’s just a sampling of the different projects that we’re currently working on.
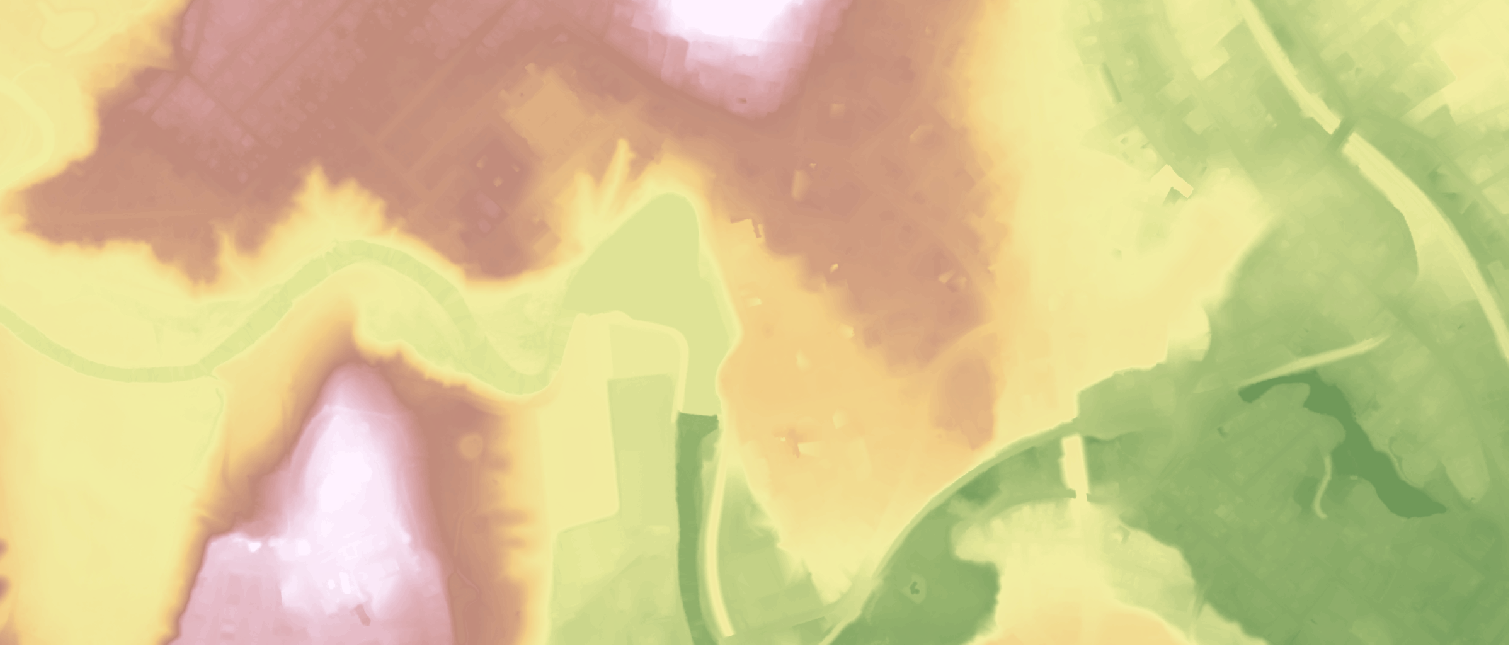
The new LiDAR elevation data for Northampton is so detailed that you can pick out features like buildings, roads, the quad, and the levee on Lower College Lane.
Prof. Bob Newton’s Geomorphology class is one of the main users of our lab each spring semester. Many moons ago, analyzing paper topographic maps – specifically the 15 minute USGS quadrangles – was the bread and butter of geomorphology labs. Then along came Digital Elevation Models (DEMs), raster files based on the topo maps. At first they had a cell size of 30m-90m, but eventually this was whittled down to 5m. Finally, LiDAR came along. LiDAR (a portmanteau of “light” and “radar”) is an ultra-high resolution method for gathering elevation data from airplanes. Bob started having his classes analyze LiDAR data with GIS just last year, and this year he’s made LiDAR an even bigger part of the curriculum. LiDAR elevation data is constantly being generated for more and more regions around the world, meaning this is a very cool time to study geomorphology.
One of the most exciting datasets that we’re helping his class use is brand new LiDAR data for Northampton, collected last spring. With a horizontal precision of 1m and a vertical precision of 18cm, it’s amazing what features you can make out in the landscape. Using these data, Bob’s students modeled the extent of Glacial Lake Hitchcock, which covered most of the Connecticut River Valley when the Connecticut River was damned near Rocky Hill, Connecticut, presumably by aliens.* They located features in the hills of Northampton which could have been the shoreline of Glacial Lake Hitchcock. Geologists have not yet mapped the shores of Glacial Lake Hitchcock in great detail in this area, so the students’ findings might make some waves in the local geology community!
*another theory regarding the dam suggests it was actually the terminal moraine of a continental ice shelf.
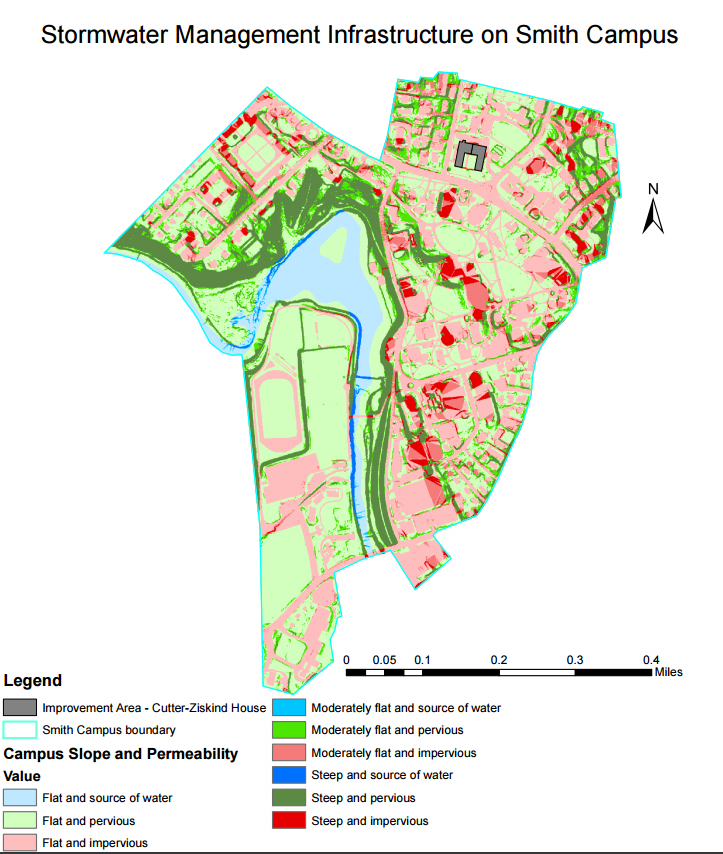
A map showing risk of high water runoff on Smith’s campus based on surface permeability and slope. This map was designed by Sydney Bobrow, an intended ES&P major currently taking ENV 201/202. (Click for full-size map)
We recently wrapped up a month of GIS and GPS labs in Prof. Camille Washington-Ottombre’s class “Environmental Integration II: Collecting and Analyzing Information” (aka ENV 201/202). For the students’ first experience with GPS, we set up a GPS scavenger hunt around campus. To start off, we gave each team a topo map with the location of the first clue. After determining the clue’s coordinates, they navigated to the next clue with their GPS units, where they found a topo map leading them to the next clue. At the end of the scavenger hunt, the teams uploaded their GPS data and discovered that they had unknowingly drawn something by walking from clue to clue. What did they draw, you ask? You’ll have to take ENV 201/202 to find out for yourself!
In preparation for the class’s first GIS lab, we gathered all kinds of data about environmental justice in Northampton – demographic information, airborne toxin levels, and flood risk, just to name a few. After discussing the principles of cartographic design and the place of GIS in the broader history of cartography, the students used these data to explore the landscape of environmental risk in Northampton. For their second GIS lab, students examined the impact of impermeable surfaces on runoff at Smith. Using several criteria – permeability, slope, and runoff accumulation – each student chose an impermeable area on campus to convert to permeable surface. Then, they determined the net cost savings based on construction costs and the annual amount saved on the City of Northampton’s tax on impermeable surfaces.
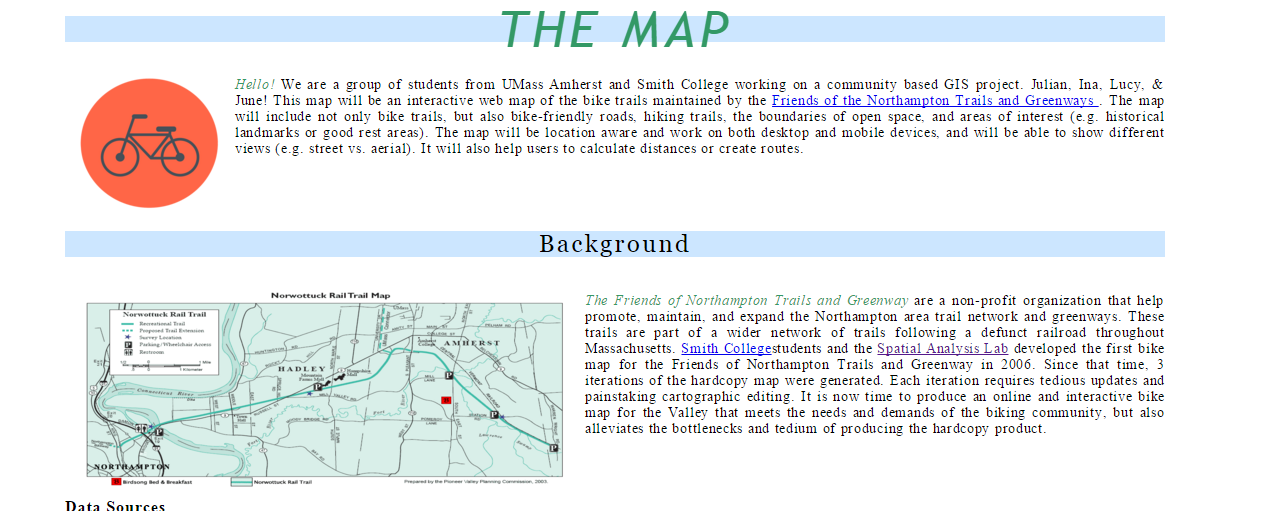
A draft website designed by the students collaborating with Friends of Northampton Trails and Greenways
Every Friday, we head over to a course called “Community Service with Web GIS” at UMass with five Smith students and two fellow staff members. In this class, co-taught by Jon, Charlie Schweik (Professor of Environmental Conservation and Public Policy at UMass), and Andy Anderson (Academic Technology Specialist at Amherst College), students are learning how to make a web mapping application from scratch using open-source tools such as QGIS, PostgreSQL, PostGIS, Geoserver, and Leaflet.js. We’ve already covered databases and servers, the so-called “back-end” side of web development. Now, we’re covering HTML, CSS, SVG, and JavaScript – the “front-end” side of web development. Once we’re finished with this, the students will dedicate the rest of the semester to applying their new skills towards creating a web mapping application that benefits one of the Five Colleges or a local non-profit. The Smith students are working on two projects: an interactive map of bike trails for the Friends of Northampton Trails and Greenways and an improved dashboard for presenting facility data (such as energy usage, water usage, etc) on Smith’s campus. The two Smith staff members who are auditing the class will be improving the Botanic Garden’s current webmap of their plant collection around campus. Jon and I have enjoyed learning about these cutting-edge technologies along with the students and are excited to see the evolution of their final projects.
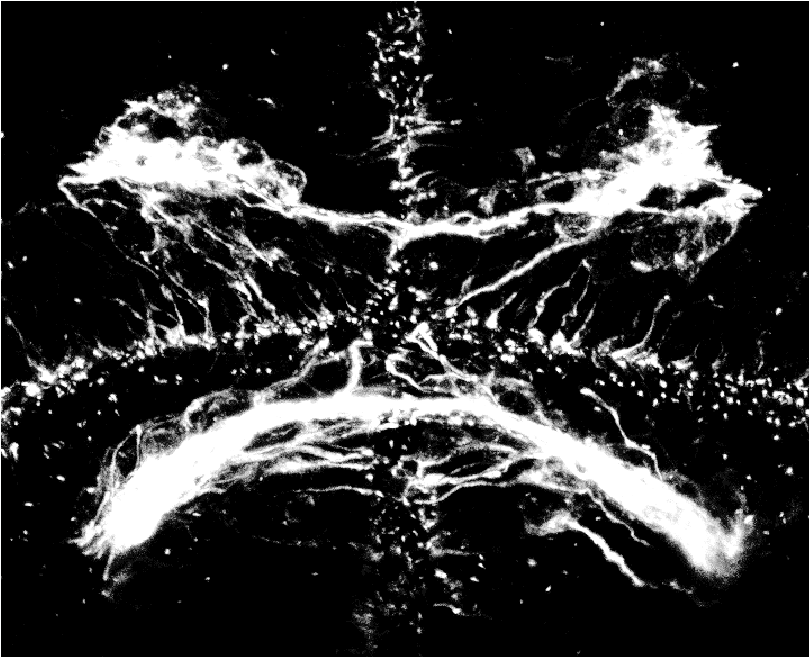
Image of the post-optic commissure in a zebrafish embryo
For the past three years, the SAL has been helping the Michael Barresi lab to analyze images of zebrafish embryo brains in order to study the normal and abnormal formation of the post-optic commissure, a brain structure that connects the two hemispheres of the zebrafish brain, similar to humans’ corpus callosum. Recently, we’ve been helping the lab to automate the analysis process – that is, using a Python script that can analyze hundreds of images in a row instead of having to click through each tool in ArcGIS. Once functional, this tool will provide a much faster and more objective way to evaluate the abnormality of the POC in each image than the lab’s previous method, which involved evaluating each image by eye and assigning it a value on a 5-point scale of abnormality.
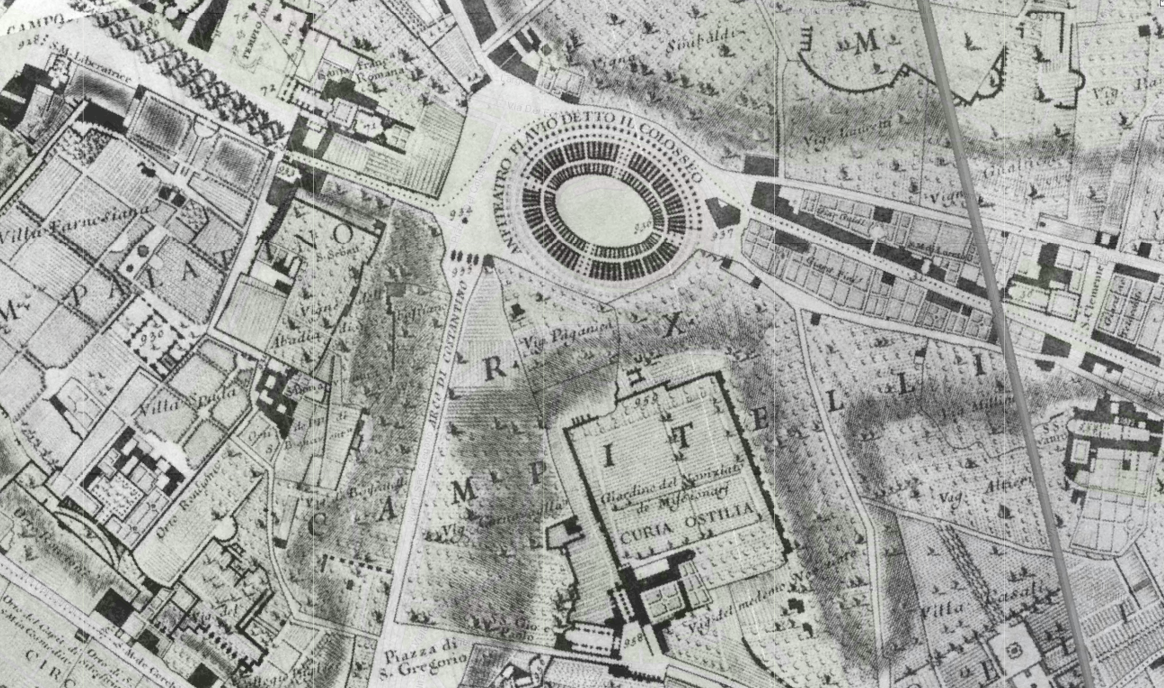
The Colliseum is pictured on a 1748 map of Rome by Giambattista Nolli that will be on display for the exhibit.
Finally, in a first for the SAL, we’re collaborating with the Smith College Museum of Art to develop a digital supplement to their upcoming exhibit “When In Rome,” which will feature paintings, photographs, and other works from the Renaissance to the modern era featuring Roman landmarks. The digital supplement will consist of one or more Story Maps that will help visitors to place each landmark in Rome and contextualize it in the unique history of the city.
Jumping from geology to neuroscience to art history is no easy task for us, but the challenging, interdisciplinary nature of the work that we do in the SAL makes us look forward to coming into work every morning. We’re proud to call the SAL a campus crossroads, and we think that the diversity of people and departments with which we collaborate exemplifies the unique benefits of learning and teaching at a small liberal arts college. As the SAL continues to grow, we look forward to making partnerships with an even broader group of constituents. By bringing together different perspectives and a shared intellectual curiosity, we know we can continue to do some very cool things.