Participations from the SAL during the week of October 13th-17th:
1. Lying with Maps: initial lab session with ENV311
2. Meeting with Lewis Global Studies Center about Study Abroad data
3. Ebola Mapping Workshop at Amherst College
4. Finalized India Rainfall Maps with Economics Professor Vis Taraz
5. One-on-one sessions with “mappers” from Study of Women and Gender course focusing on Food Access in Springfield
6. Support DEM Download
1. Lying with Maps Lab: ENV311
SAL Director Jon Caris instructed professor Susan Sayre’s course Intepreting and Communicating Information through a GIS lab in which the students investigated data about toxic waste production in the Pioneer Valley. The class was divided into two parts, each side with an argument to defend — one half arguing that the waste sites were detrimental to health of the surrounding area, and one arguing that they are beneficial (for example: increasing job opportunities and not decreasing local health). The point of the exercise was to explore how mapped data can be manipulated to communicate many different, and often times contrasting, messages. Therefore implying the importance of ethical mapping practices.
2. Meeting with Lewis Global Studies Center
Post-bac Victoria Beckley met Lisa Johnson of the Lewis Global Studies Center to discuss the available study abroad and international student data for future mapping purposes. The data looks to be spatially promising, so keep your eye out for mapping projects of this sort in the future.
3. Ebola Mapping Workshop at Amherst College
GIS specialist and technician Andy Anderson hosted a Ebola First Responder Mapping workshop at Amherst College on Wednesday October 15th. Post-bac Victoria Beckley assisted in the event to provide additional technical support and keep our connection with Amherst alive and well.
4. Finalized India Rainfall Maps with Economics Professor Vis Taraz
We wrapped up our mapping project with Economics professor Vis Taraz in visualizing rainfall patterns in India over the past decades. To briefly describe the workflow for the map production:
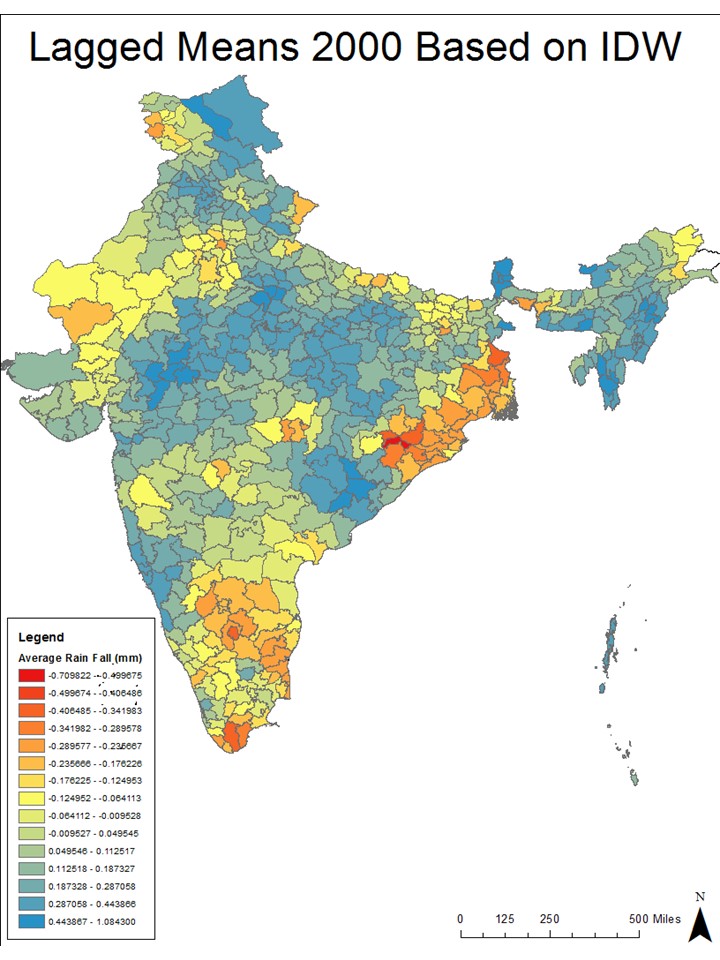 CSV file: Prof. Taraz generated a lagged means spreadsheet that contained decade averages for ’55, ’70, ’85, ’00 for each half degree of latitude and longitude
- These points were visualized in ArcMap using the display XY tool
- A spatial join was performed to summarize the point data for the district polygons
- We used an IDW interpolator to generate a raster from these polygons
- Then point dataset was extracted from this raster using the raster to point tool
- Finally a second spatial join was performed to reassign summarized values to the district polygons
- Then we used specific classification to symbolize the data in a uniform way
Here is an image of one of the resulting maps:
For more background on the project, click here.
5. One-on-one sessions with SWAG Mappers
Post-bac Victoria Beckley began meeting with the mapping group from Professor Lisa Armstrong’s SWAG course, Gender, Land, and Food Movement. We plan to produce an interactive web mapping application that will tell the story of the Mason Square farmers market in Springfield. More on the project here.
6. DEM Hunting and Downloading
Senior Eliana Perlmutter is working with professor Bob Newton to look at landslides visible from DEM aerials. The process of locating data of this type that is both quality and compatible with ArcMap can be quite challenging, so we offered our support. Eliana did the heavy lifting, we just pointed her in the right direction.