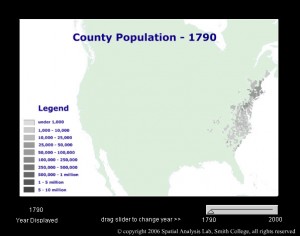
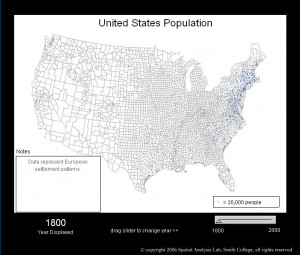
Historic census data were collected from the University of Virgina’s Geospatial and Statistical Data Center and processed in ESRI’s ArcGIS software to generate historic time period overlays.
Flash Maps
- Dot Density Map (updated March 2010)
Choropleth Map (updated March 2010)
Attribution:
Caris, J. & Stearns, C. (2006). Smith College Spatial Analysis Lab. [U.S. Historic Settlement Patterns 1790-2000 animation]. Data sources: TeleAtlas and US Census Bureau, ESRI Data and Maps, 2006.
Thanks and acknowledgment to ESRI’s George Dailey and Ray Carnes for data discovery and to SAL assistant Abby Mannelin for data processing.
Side note: After looking at some of the traffic on this particular map animation, I realized that many people picked up the link and started quite a heated dialog. I never dreamed that such fist-o-cuffs would erupt over our animated map showing US settlement. I (and some of the students who work with me) created this map for a political science instructor here at Smith College. I took it off-line for a period because:
1. I was receiving way too many requests for the data (all of which I answered)
and
2. People were emailing snarky little comments about leaving out native americans, canadians!, etc.
You can follow some of the tirade at the reddit site. I ultimately re-enabled the site after an email from a grade school teacher in Pennsylvania who uses the site in her teaching. The map animations were also requested for use by the Oklahoma Historical Society Museum. Live and learn.

